


Refer to PSP 27th Perihelion Campaign page.
2026-03-10 (CSV, PDF table of coordinates)
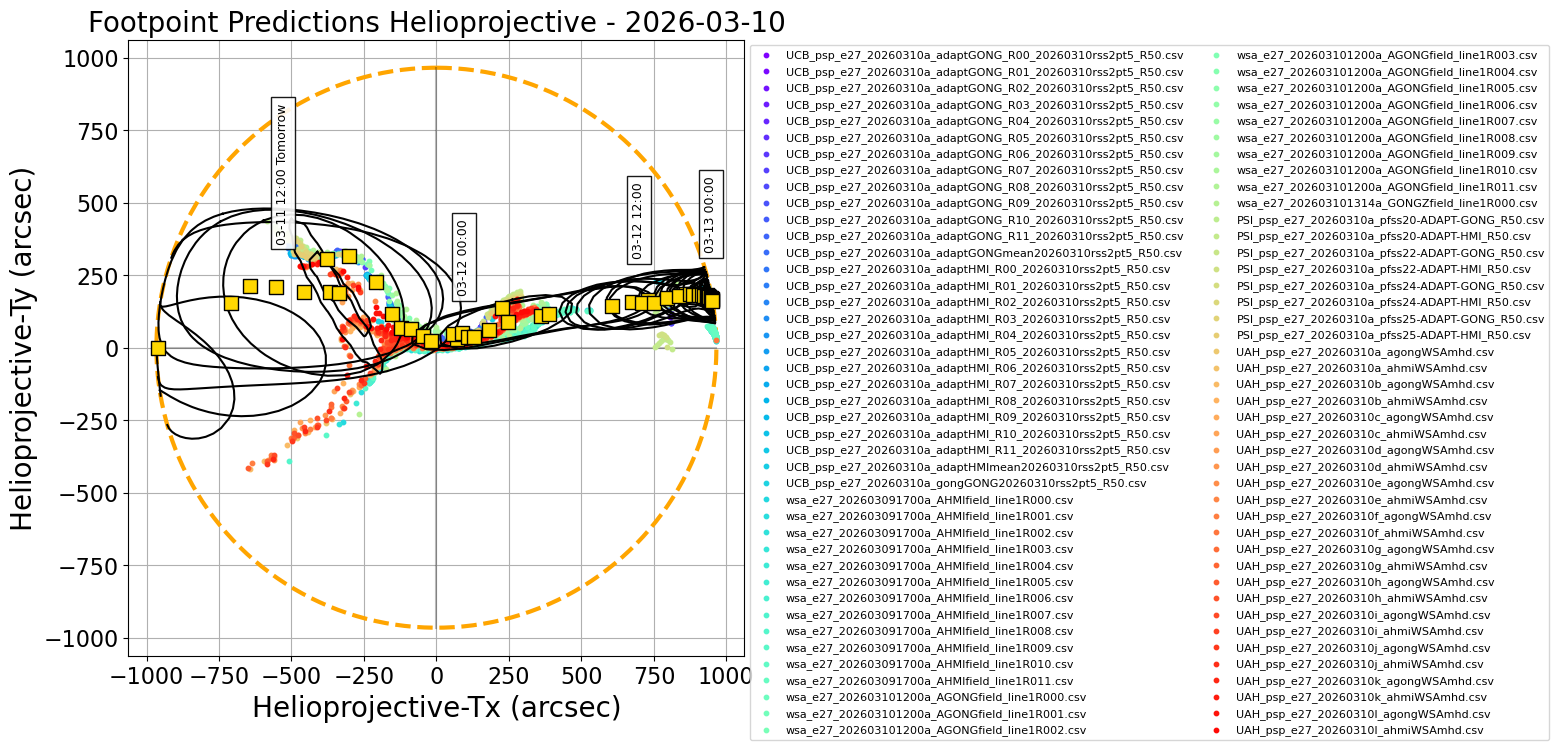
Figure 1.
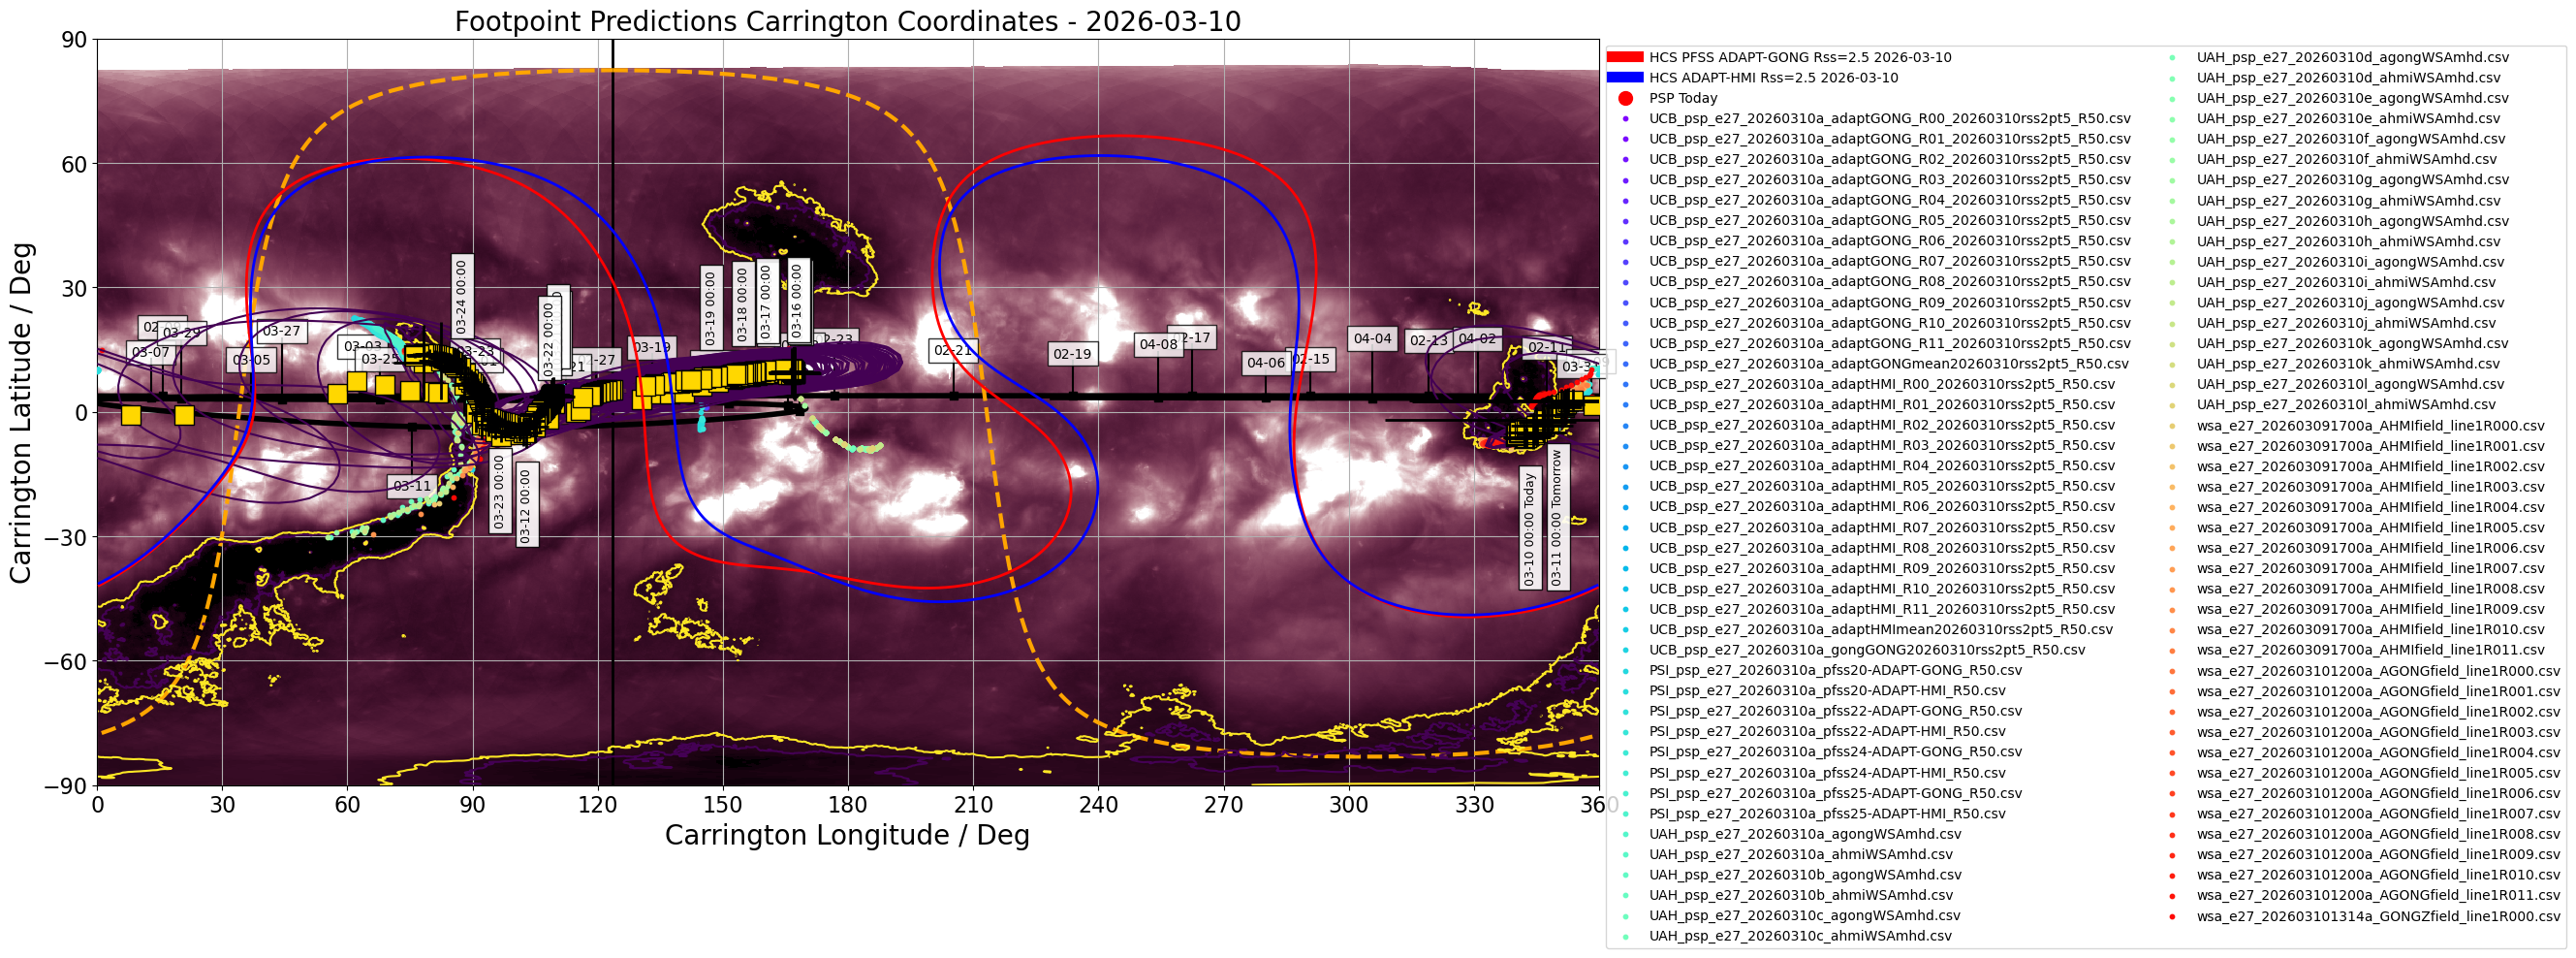
Figure 2.
Figures above show one footpoint per day plotted on the solar disk and in Carrington coordinates (click on figure to zoom and see caption).
The predicted footpoints were kindly provided by the PSP 24rd Perihelion modeling team.
2026-03-11 (CSV, PDF table of coordinates)
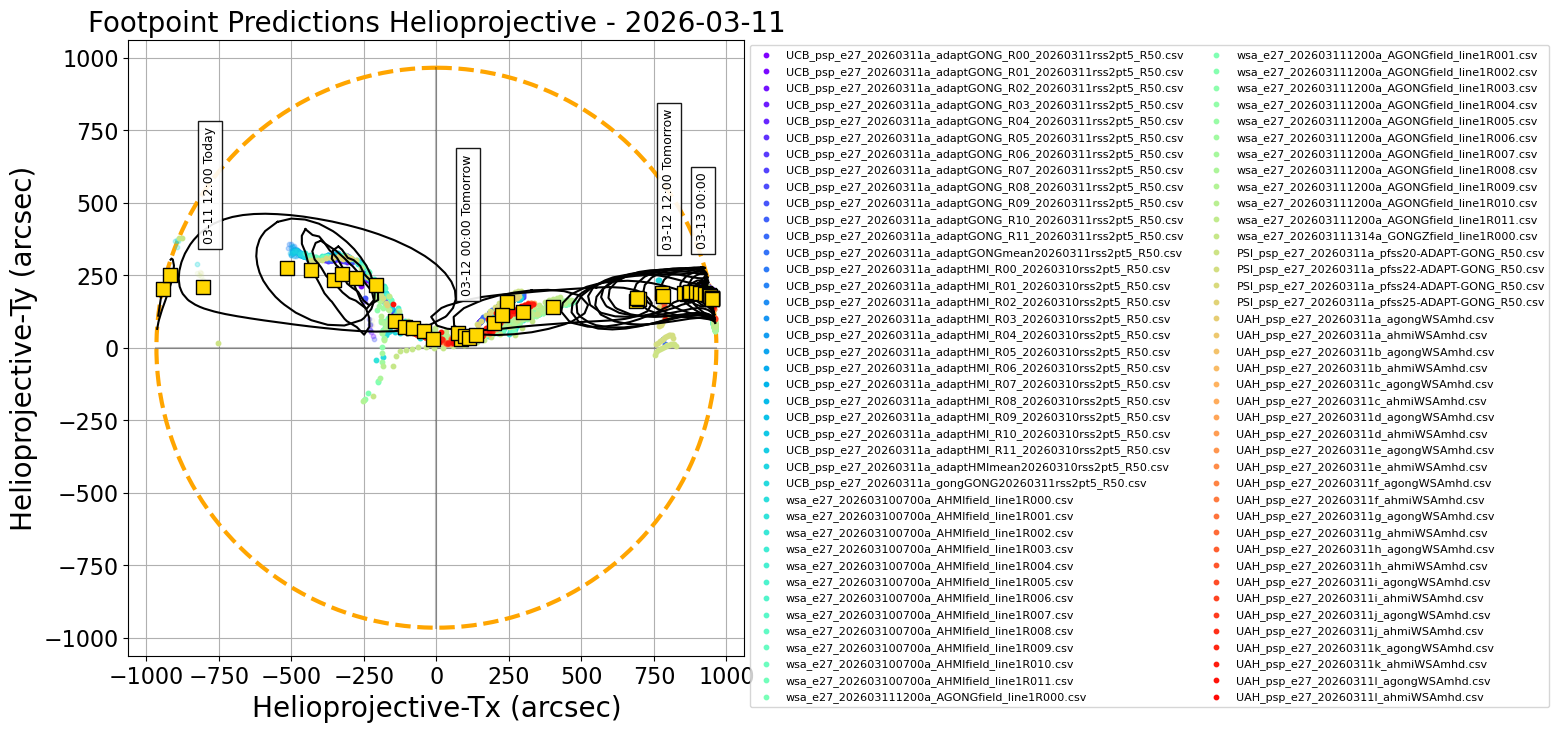
Figure 1.
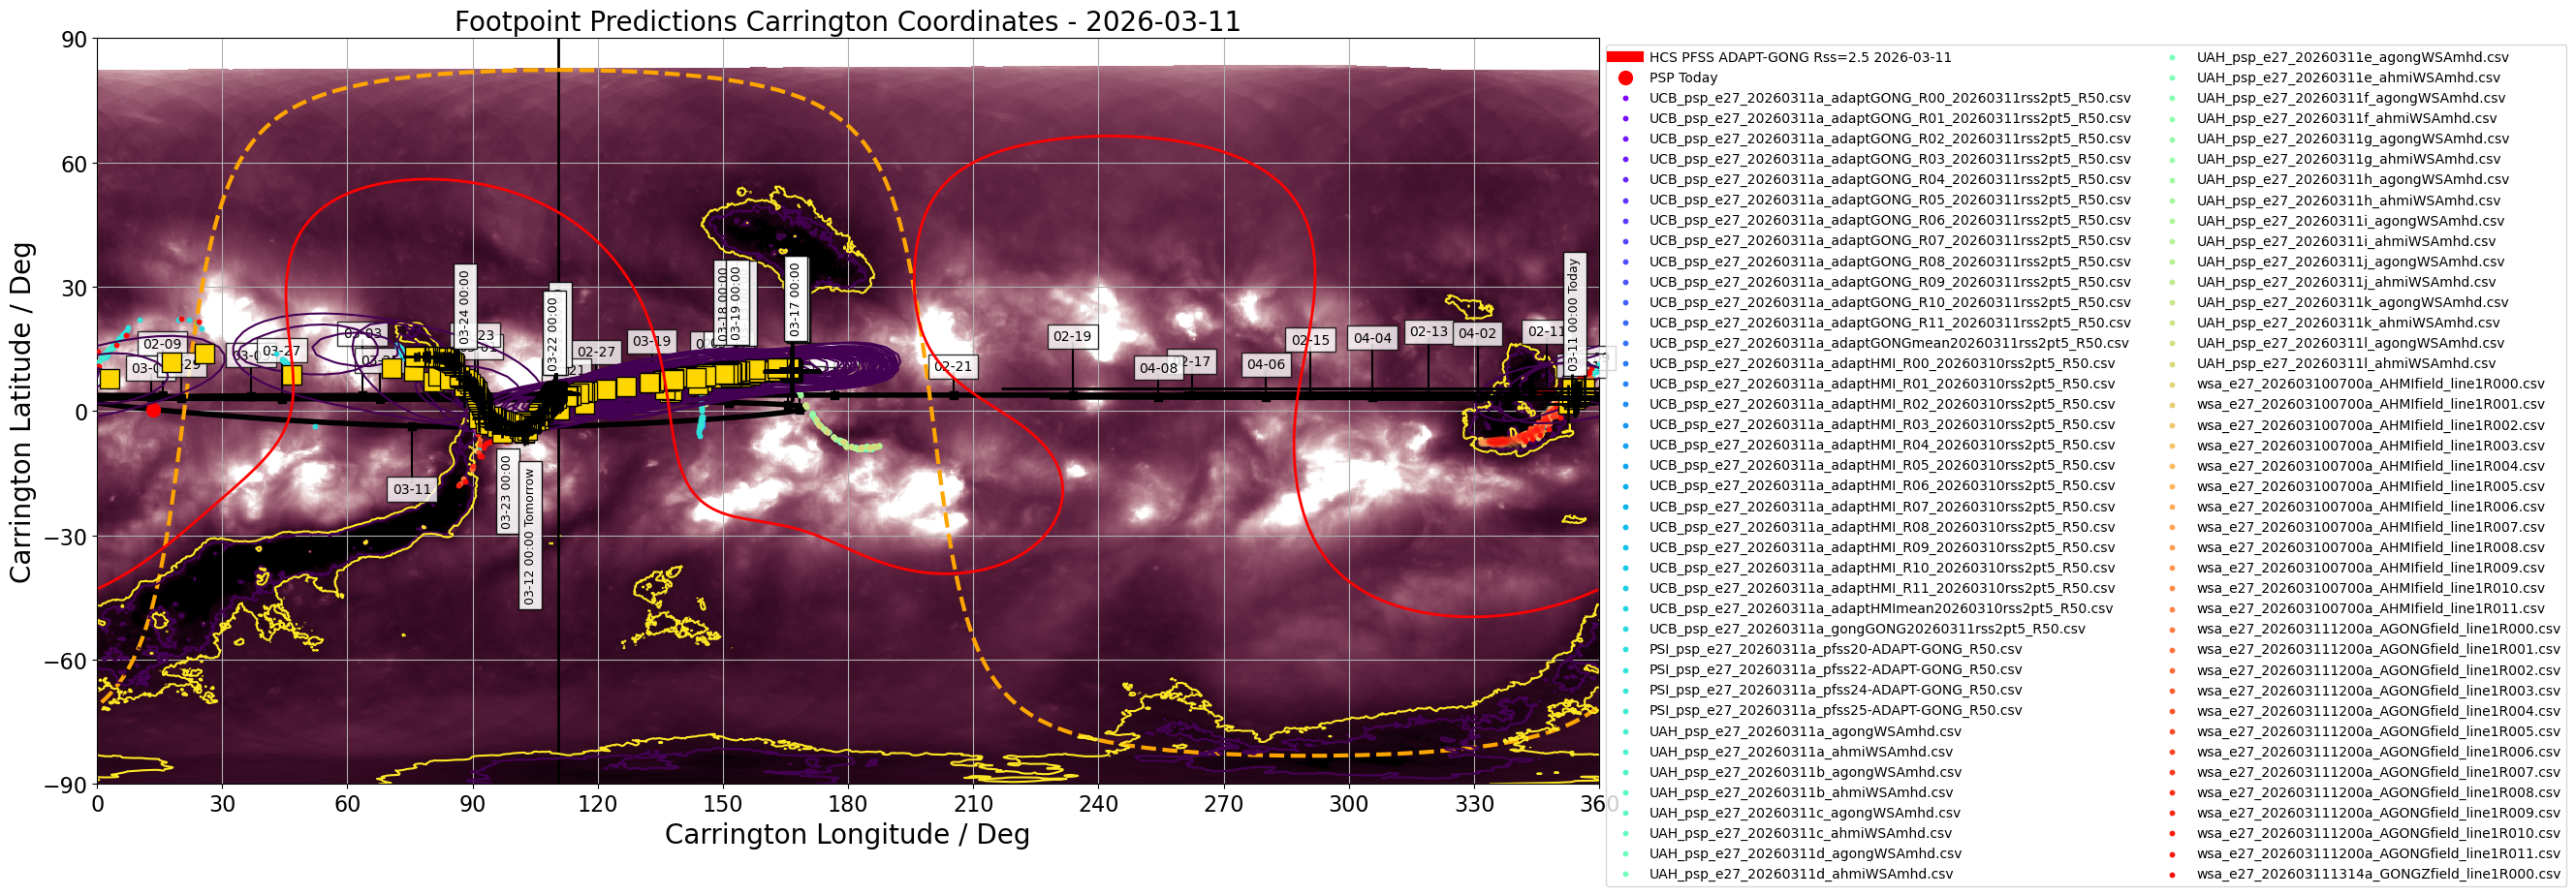
Figure 2.
Figures above show one footpoint per day plotted on the solar disk and in Carrington coordinates (click on figure to zoom and see caption).
The predicted footpoints were kindly provided by the PSP 24rd Perihelion modeling team.
Encounter 27 Prediction update 2/4: 2026/03/11
------------------------------------------------
This is the second of four daily footpoint predictions issued through Friday March 13 for Parker Solar Probe Encounter 27, Parker's 6th perihelion at 9.86Rs which occurs today 2026/03/11 at 18:17 UT (14:17 EDT). Parker is currently moving rapidly across the visible solar disk, crossing the central meridian today, and then rapidly progressing over to the West limb, with footpoints going behind the limb by end of day Friday 2026/03/13. The predominant solar feature shaping connectivity remains an extended positive polarity equatorial boomerang-shaped positive-polarity coronal hole visible near the central meridian (https://www.solarmonitor.org/full_disk.php?date=20260311&type=saia_00211®ion=&indexnum=1).
Magnetic Connectivity
---------------------
Parker footpoints are predicted to have reached the above equatorial coronal hole at approximately 1400 UT.
Over the course of the next half day, while the spacecraft continues to move rapidly, the footpoints remain relatively stationary, tracking gradually from a positive latitude portion of the coronal hole near to AR 14387 down to the western-most extent of the coronal hole near the equator.
At or around Thursday (tomorrow) 2026/3/12 0900 UT, the footpoints move westwards of the coronal hole and track across smaller disparate equatorial locations, gradually approaching the West limb, before disappearing behind it around 2026/3/13 1100 UT.
After the instantaneous connectivity leaves the coronal hole, it will likely remain a compelling target to continue to study since it will likely be prominent in the Parker Solar Probe data.
This coronal hole is expected to reach the West limb around 03/19 at which point off-limb observations of its low coronal evolution may be fruitful.
Flare Likelihood (CCMC Flare Scoreboard)
----------------------------------------
As of 2026/03/11 at 12:00 UT, the CCMC Flare Scoreboard gave 24-hour average cumulative flare probabilities amounting to 83%, 10% and 1% for GOES C and above, M and above and X-class flares, respectively, similar to yesterday’s prediction. The strongest flare observed over the past 24 hours was a GOES C4.6 at 2026/03/10T18:31 UT, originating from NOAA AR 14381. Sunspot complexes present on the disk include NOAA ARs 14378, 14380, 14381, 14384, 14385, and 14387 - 14389. AR 14389 is in proximity to AR 14387 in the Eastern hemisphere with all other active regions beyond 40 deg in the Western hemisphere. The transequatorial coronal hole reported yesterday has rotated, with its westernmost part on the central meridian. Some transient activity appears within the coronal hole and will likely be sampled by PSP around today’s perihelion.
From the CCMC CME Scoreboard, there is no change since yesterday’s prediction, with no apparent Earth-directed CME at this time.
------------------
*** Please note that the "arrival time" and "emission time" and associated Tx/Ty coordinates for both are reported in the consensus CSV file. The attached plots show the "arrival time" (location of source at time that plasma will arrive at PSP). See https://docs.google.com/presentation/d/1mz02FU24vqKxxLRaJlyScfAh8gB07iOlBsTHApvhls8/edit#slide=id.p for some discussion on these***.
2026-03-12 (CSV, PDF table of coordinates)
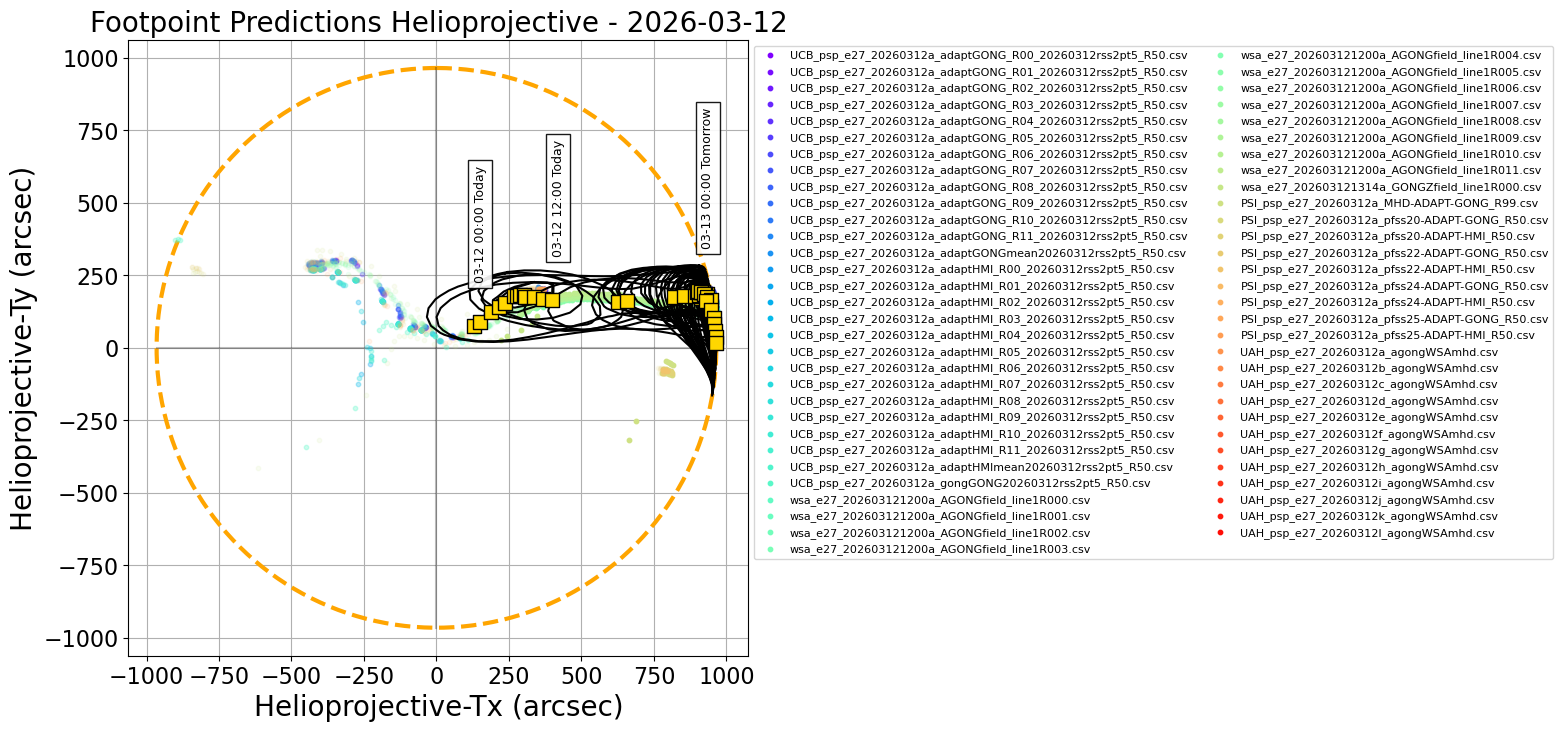
Figure 1.
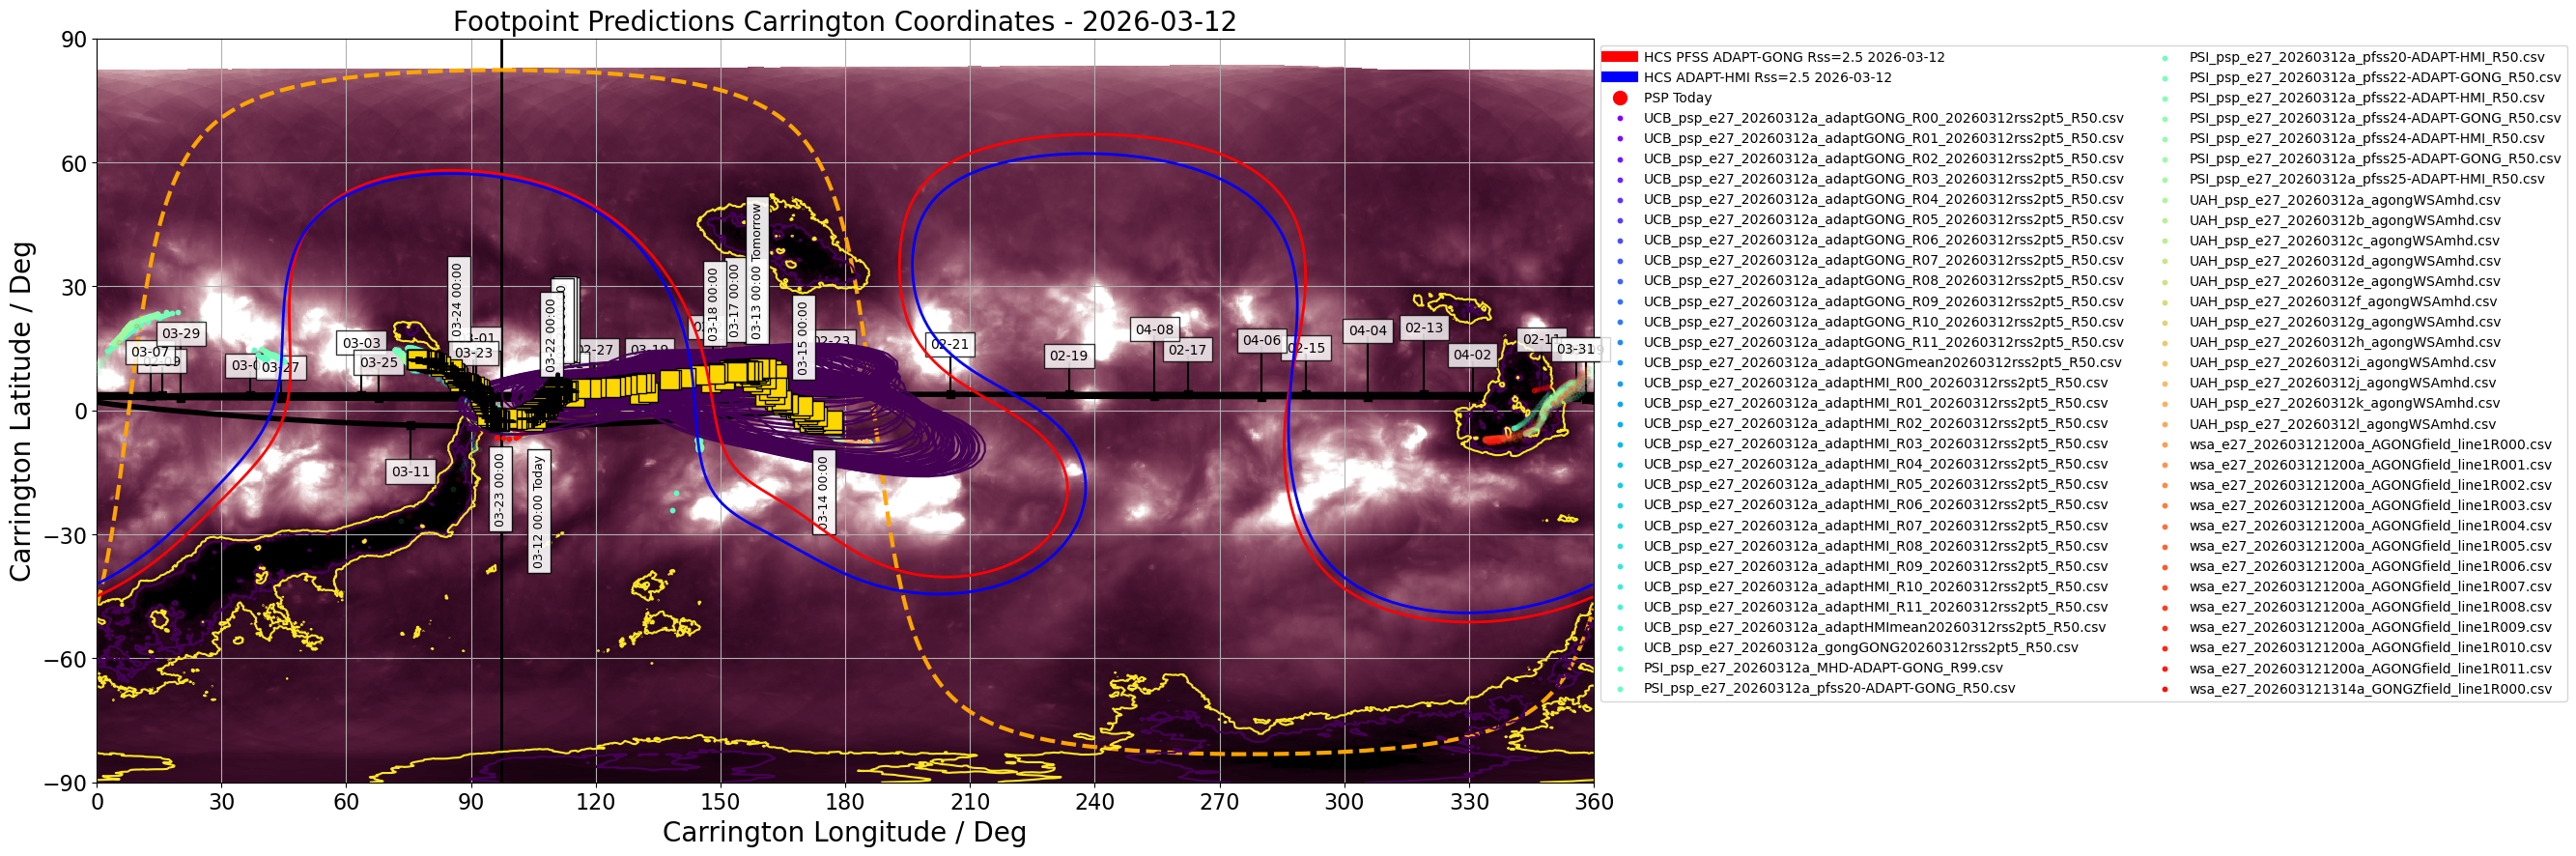
Figure 2.
Figures above show one footpoint per day plotted on the solar disk and in Carrington coordinates (click on figure to zoom and see caption).
The predicted footpoints were kindly provided by the PSP 24rd Perihelion modeling team.
Encounter 27 Prediction update 3/4: 2026/03/12
------------------------------------------------
This is the third of four daily footpoint predictions issued through tomorrow, Friday March 13 for Parker Solar Probe Encounter 27, Parker's 6th perihelion at 9.86Rs which occurred yesterday 2026/03/11 at 18:17 UT (14:17 EDT). Parker is currently moving rapidly across the visible solar disk towards the West limb, with footpoints going behind the limb by end of day Friday 2026/03/13. The predominant solar feature shaping connectivity remains an extended positive polarity equatorial boomerang-shaped positive-polarity coronal hole visible near the central meridian (www.solarmonitor.org).
Magnetic Connectivity
---------------------
Earlier today (around 2026/3/12 1200 UT), Parker's instantaneous footpoints are predicted to have moved westwards of the above coronal hole and are tracking across smaller disparate equatorial locations, gradually approaching the West limb, before disappearing behind it tomorrow around 2026/3/13 1200 UT.
Despite the instantaneous connectivity having left the coronal hole, it remains a compelling target to continue to study since it will likely be prominent in the Parker Solar Probe data.
Additionally, this coronal hole is expected to reach the West limb around 03/19 at which point off-limb observations of its low coronal evolution may be fruitful.
Flare Likelihood (CCMC Flare Scoreboard)
----------------------------------------
------------------
*** Please note that the "arrival time" and "emission time" and associated Tx/Ty coordinates for both are reported in the consensus CSV file. The attached plots show the "arrival time" (location of source at time that plasma will arrive at PSP). See this doc for some discussion on these***.
2026-03-13 (CSV, PDF table of coordinates)
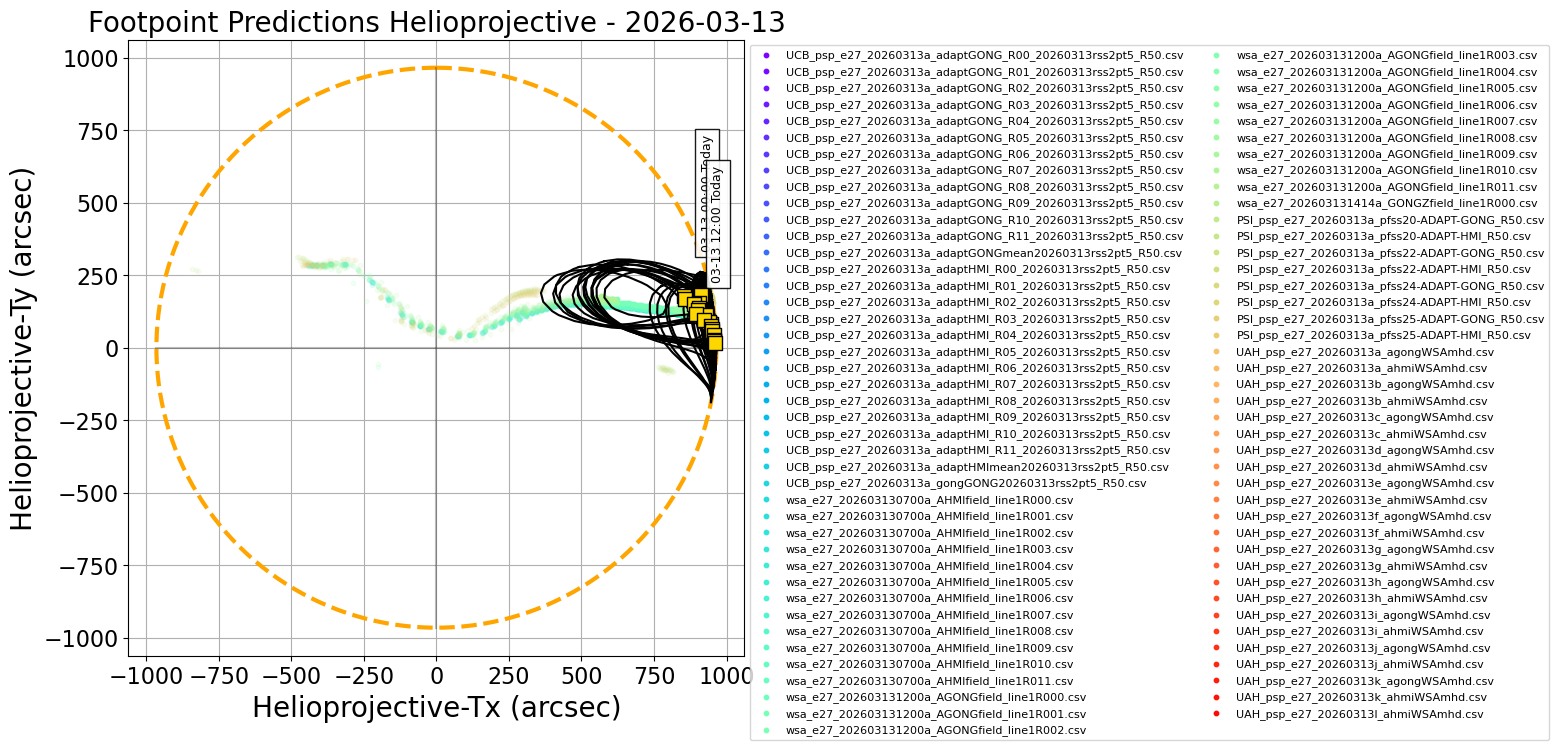
Figure 1.
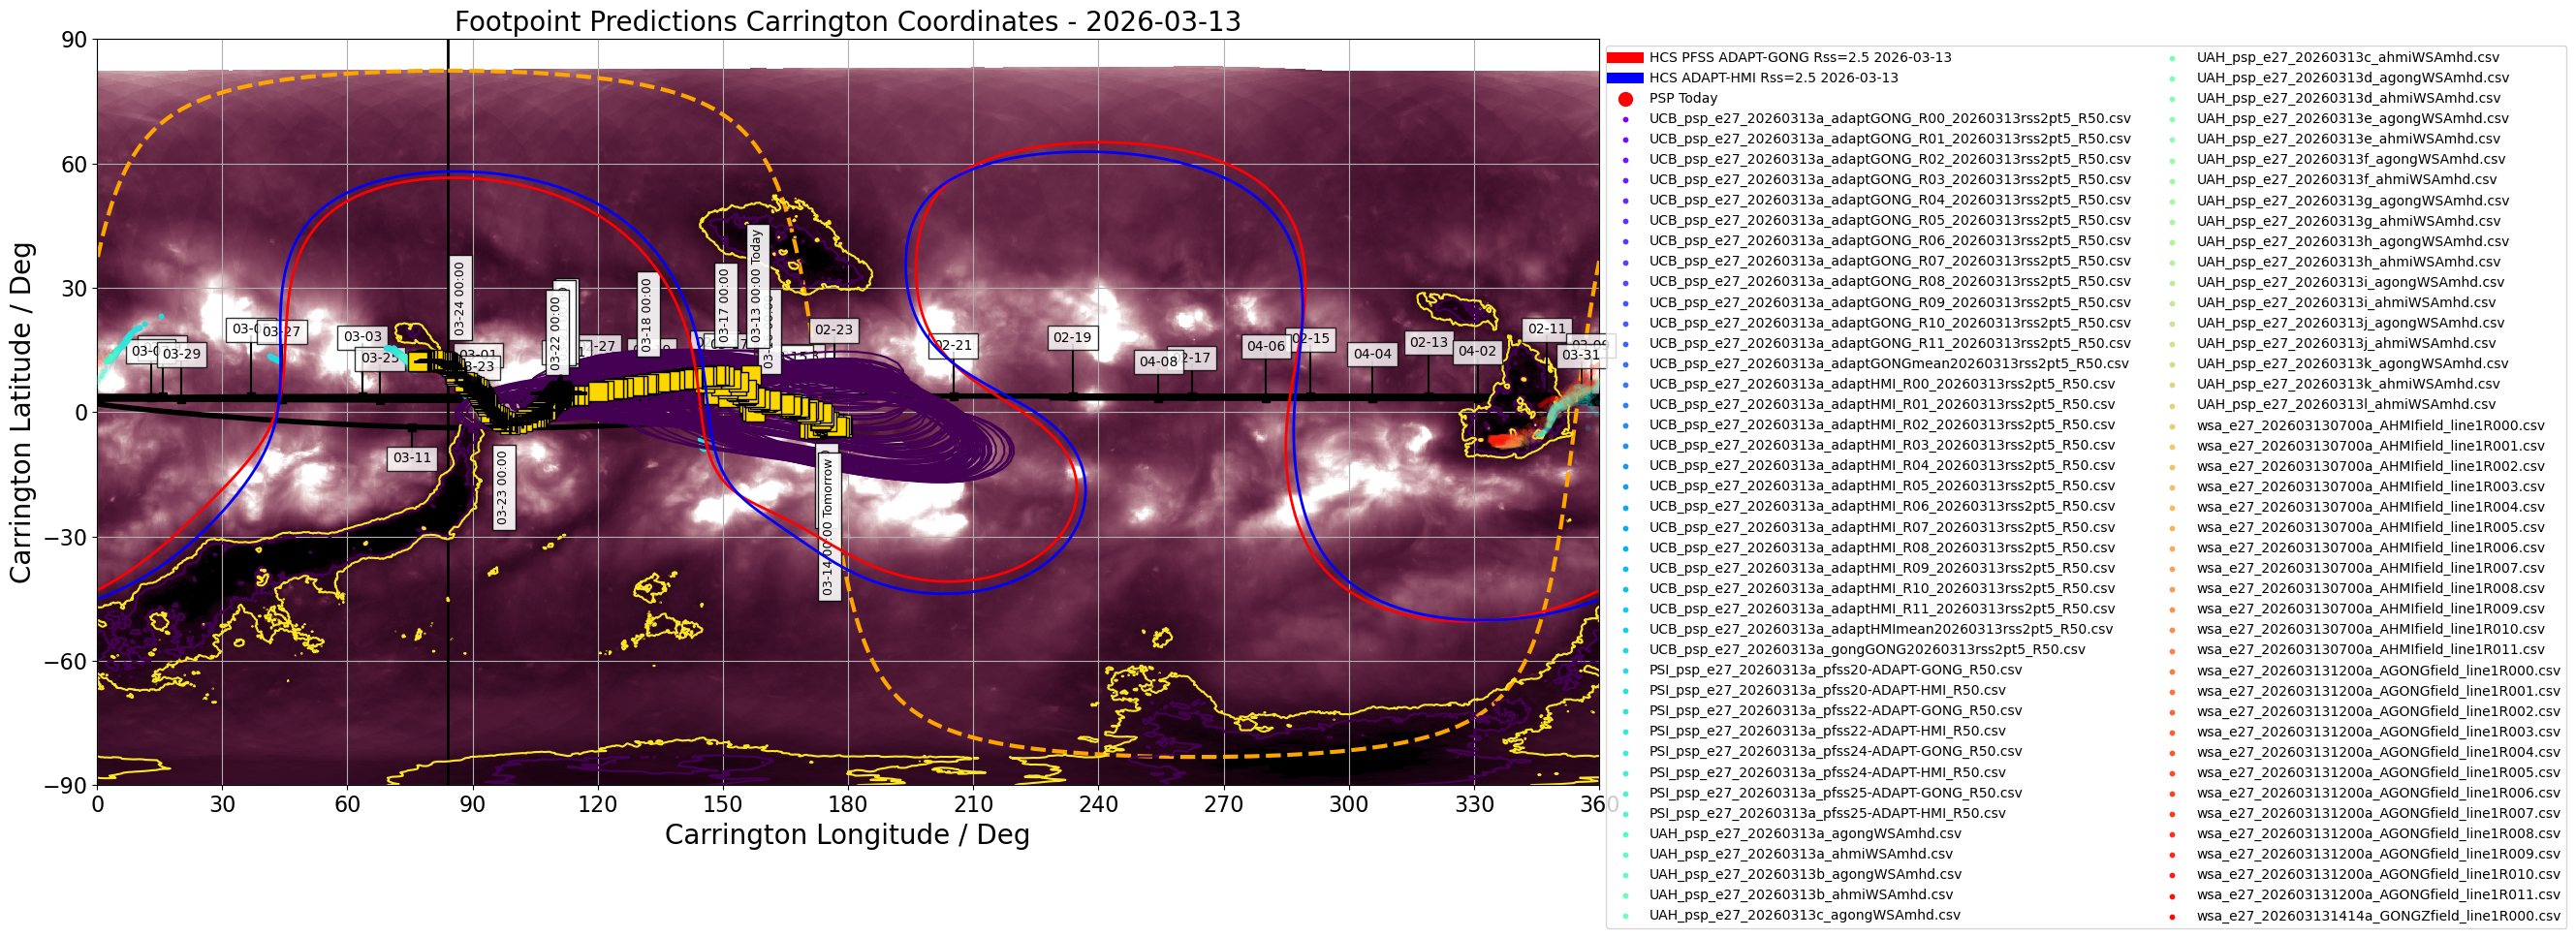
Figure 2.
Figures above show one footpoint per day plotted on the solar disk and in Carrington coordinates (click on figure to zoom and see caption).
The predicted footpoints were kindly provided by the PSP 24rd Perihelion modeling team.
Encounter 27 Prediction update 4/4: 2026/03/13
------------------------------------------------
This is the last of four daily footpoint predictions issued for Parker Solar Probe Encounter 27, Parker's 6th perihelion at 9.86Rs which occurred on 2026/03/11 at 18:17 UT (14:17 EDT). Parker is currently physically located above the West limb and its footpoints are moving behind the visible disk today. The clearest solar feature which shaped connectivity in this encounter remains an extended equatorial boomerang-shaped positive-polarity coronal hole visible just west of the central meridian (solarmonitor.com).
Magnetic Connectivity
---------------------
Parker's footpoints have bounced across several disparate equatorial sources and are predicted to cross the West limb as of 2026/3/13 1900 UT.
Despite the instantaneous connectivity having left the major coronal hole, it remains a compelling target to continue to study since it will likely be prominent in the Parker Solar Probe data.
Additionally, this coronal hole is expected to span the West limb around 03/16-03/19 at which point off-limb observations of its low coronal evolution may be fruitful.
Flare Likelihood (CCMC Flare Scoreboard)
----------------------------------------
As of 2026/03/13 at 12:00 UT, the CCMC Flare Scoreboard gave 24-hour average cumulative flare probabilities amounting to 88%, 14% and 1% for GOES C and above, M and above and X-class flares, respectively, very similar to yesterday’s prediction. The strongest flare observed over the past 24 hours was a GOES M1.2 at 2026/03/10T09:48 UT, likely originating from NOAA AR 14384, close to the Western limb. Sunspot complexes present on the disk include NOAA ARs 14384, 14385, and 14387 - 14393. Active regions are now spread from over the Earthward solar hemisphere, practically from Western to the Eastern limb. Most are located in the Northern hemisphere. Much of the transequatorial coronal hole reported in previous updates is now beyond the central meridian, with its southern arm still in the Eastern hemisphere.
From the CCMC CME Scoreboard, the prediction is the same as yesterday, with no apparent Earth-directed CME at this time.
------------------
*** Please note that the "arrival time" and "emission time" and associated Tx/Ty coordinates for both are reported in the consensus CSV file. The attached plots show the "arrival time" (location of source at time that plasma will arrive at PSP). See this document for some discussion on these***.
Date and arrival time of plasma parcel at PSP, consensus carrington longitude (deg), latitude (deg), error in longitude, error in latitude, on-disk position of predicted source in X and Y (arcseconds) at arrival time, date and emission time of plasma parcel at the source, on-disk position of predicted source at time parcel is emitted. Each row is the updated source location each hour.
The consensus is generated by forming a distribution of footpoint predictions from all modelers for each hour period, and attempting to fit a Kent distribution. If the fitting fails, the median in longitude and latitude are quoted. If the fitting is successful, the quoted errors are formed by drawing random samples from the fitted distribution and computing the standard deviation in longitude and latitude of those samples. If the fitting fails, the quoted errors are the standard deviation in the longitude and latitude from the raw distribution of predictions. The full shape of the distribution is described by black contours in the associated plots on this website. More details about the procedure can be found at the following preprint of Badman et al. (2023) "Prediction and Verification of Parker Solar Probe Solar Wind Sources at 13.3Rs"
Please note the carrington coordinates (lon,lat) are valid from the quoted timestamp (in UTC) until the next timestamp. The helioprojective coordinates quoted (HP-Tx, HP-Ty) are computed from the carrington coordinate at the quoted timestamp (e.g. midnight UTC each day) and so are valid instantaneously at this time but will corotate with the Sun until the next quoted timestamp. For a discussion of the subtle difference in emission and arrival time and why both are included please see the slide deck.
Individual model prediction tables of coordinates may be found in a Public DropBox. Files in the Public DropBox have three-letter identifiers indicating the associated model (see below).
Three-letter designation for Public DropBox: UCB. Kindly provided by Sam Badman. The model is a simple ballistic propagation from PSP down to the source surface assuming slow wind 360km/s, and then tracing this sub-PSP trajectory through a PFSS model to get footpoints at the photosphere. The source surface height here is 2.5Rs. The PFSS model is generated using various ADAPT maps with GONG and HMI as input, and the model is run using the open source pfsspy package. A more detailed explanation of the model and comparison to PSP E1 results are given here.
Three-letter designation for Public DropBox: PSI. Kindly provided by Pete Riley. For these predictions, PSI is using a combination of modeling approaches, including PFSS solutions, empirically-based polytropic MHD solutions, and a more sophisticated approach that includes the effects of waves and turbulence to heat the corona and the WKB approximation for wave pressures to accelerate the solar wind. Additionally, boundary conditions are derived from both HMI and ADAPT synoptic magnetograms. Together, these allow us to generate a rich set of ensemble realizations from which to make our optimal prediction, as well as pool them with other teams’ forecasts to derive a hyper-ensemble prediction.
Three-letter designation for Public DropBox: wsa. Kindly provided by Shaela Jones. The Wang-Sheeley-Arge (WSA) model is a combined empirical and physics-based model of the corona and solar wind. The coronal portion of the Wang-Sheeley-Arge (WSA) model is comprised of the Potential Field Source Surface (PFSS) and Schatten Current Sheet (SCS) models, where the output of the PFSS model serves as input to the SCS model. The solar wind portion of WSA consists of a simple 1-D kinematic propagation code that takes stream interactions into account in an ad-hoc fashion. It provides predictions of the solar wind speed and interplanetary magnetic field IMF polarity at any specified point in the inner heliosphere. The WSA model can use global maps of the photospheric magnetic flux measurements from a number of sources as its inner boundary condition; here we are using an ensemble of maps from the Air Force Data Assimilative Photospheric Flux Transport (ADAPT) model, based on input GONG magnetograms.
UAH predictions come from the University of Alabama, Huntsville Multiscale Fluid-Kinetic Simulation Suite (MS-FLUKSS, Pogorelov et al. (2014); Pogorelov (2023); Singh et al. (2022)), which can solve the Reynolds-averaged ideal MHD equations for the mixture of thermal and nonthermal solar wind ions coupled with the kinetic Boltzmann equation describing the transport of neutral atoms. An adaptive mesh refinement technique can be employed for efficient high-resolution calculations. The MS-FLUKSS heliospheric MHD model is coupled with the WSA model (Kim et al., 2020), which uses both ADAPT-GONG and ADAPT-HMI input magnetograms, with the PFSS source surface height and the WSA outer boundary at 2.5 and 10 solar radii, respectively. Hence, field line tracing is performed through the MHD domain down to 10 solar radii instantaneously at approximately 1 hour cadence, where the origin of the field line on the photosphere is already known, as described for WSA.
see Prediction and Verification of Parker Solar Probe Solar Wind Sources at 13.3Rs, Badman et al. (2023)
