


Refer to PSP 23rd Perihelion Campaign page.
2025-03-21 (CSV, PDF table of coordinates)
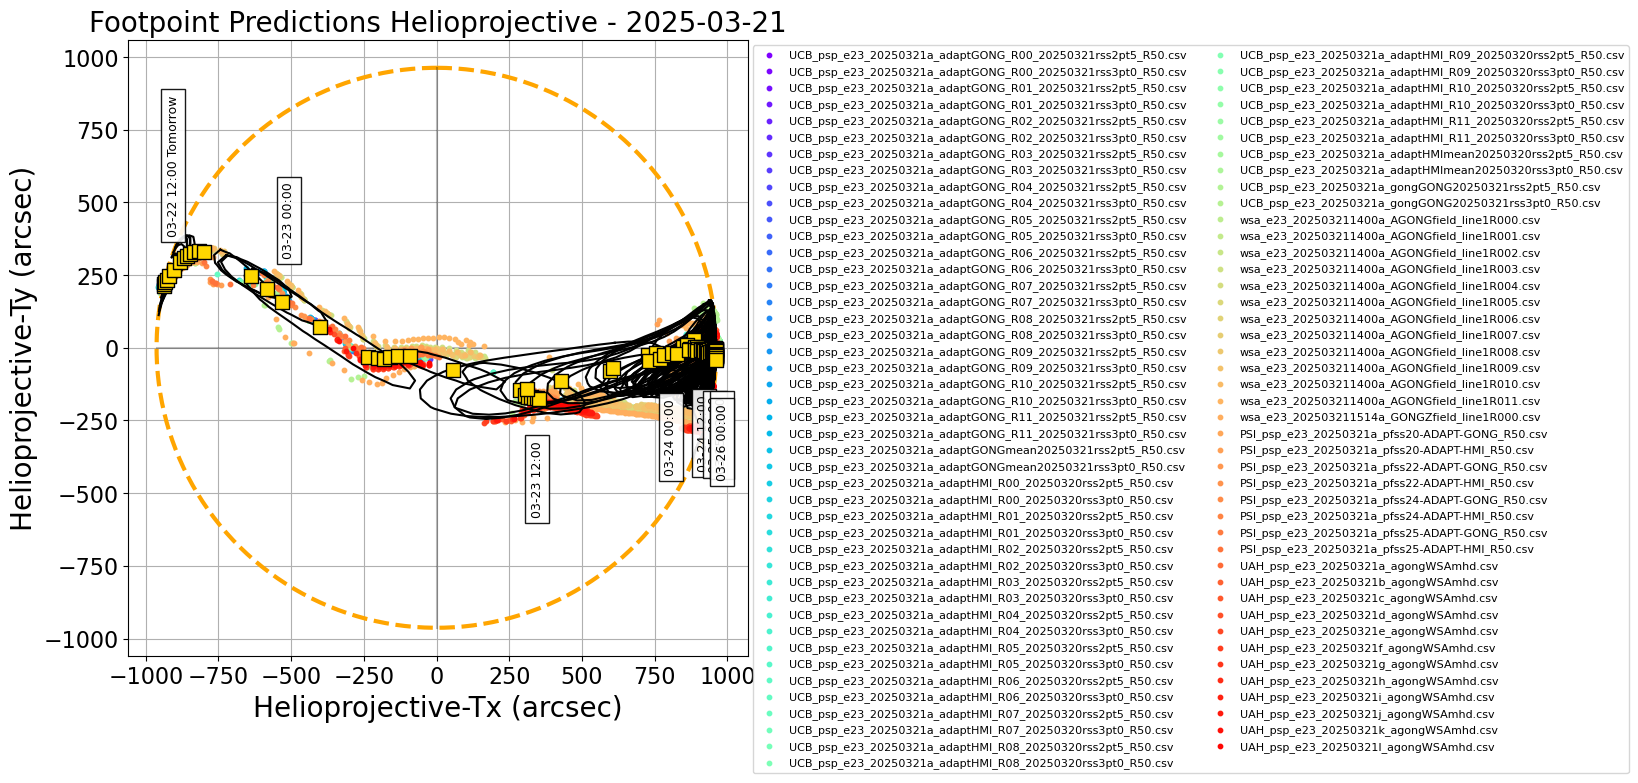
Figure 1.
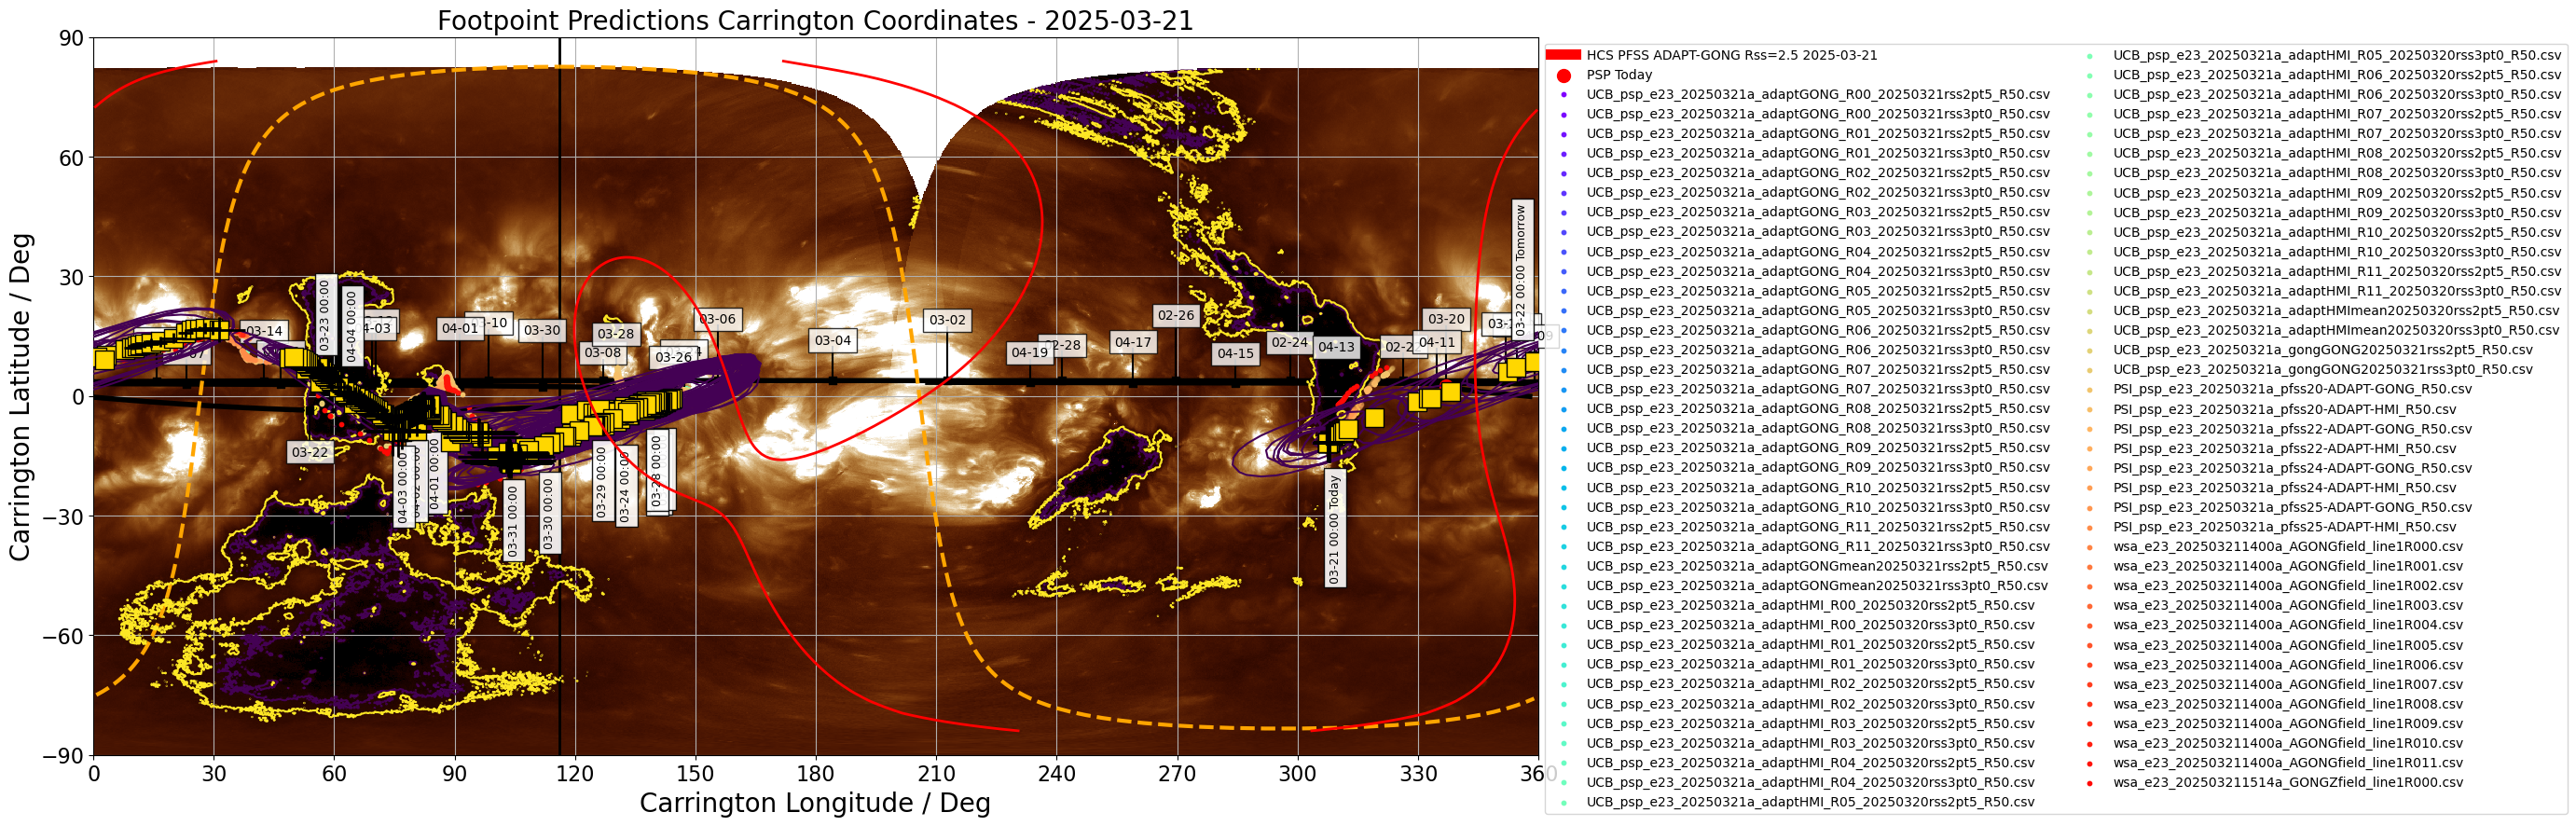
Figure 2.
Figures above show one footpoint per day plotted on the solar disk and in Carrington coordinates (click on figure to zoom and see caption).
The predicted footpoints were kindly provided by the PSP 23rd Perihelion modeling team.
Encounter 23 Prediction update 1/5: 2025/03/21
------------------------------------------------
This is the first of five footpoint predictions issued for Parker Solar Probe Encounter 23, the second time Parker will reach its record-breaking perihelion of 9.86Rs. Perihelion 23 occurs tomorrow (2025/03/22) at 22:42 UT (18:42 EDT). This orbit follows the opposite geometry to the prior one with the inbound phase having occurred over the last several days on the far side of the Sun. Today, the footpoints will come racing onto the disk over the East limb and proceeding rapidly across the disk to the West limb over the next several days, traversing the whole visible disk in record time.
Magnetic Connectivity
---------------------
The predominant feature of the prediction is a large positive polarity equatorial coronal hole which has rotated onto the East limb in the last several days. Parker is predicted to sample this source immediately preceding and following perihelion and will sample several sub-structures of it over the next couple of days. Late on March 23rd, the footpoints should jump a current sheet and connect to a negative polarity much smaller coronal hole visible just to the right of disk center in the image and movie linked below. It will then proceed to follow and eventually corotate with this source as it moves beyond the West limb. There is some timing dispersion in the current sheet between models but we are confident it will be no earlier than 1200UT on 3/23, and no later than 1200UT on 3/24. We advise observers to target the large positive coronal hole until at least 1200UT 3/23 (and potentially for longer as Solar Orbiter and the Earth will both sample wind from this coronal hole in the coming days too). Parker's passage over the West limb is predicted for 2025/03/25 around 0800UT.
The relevant sources are visible here from the Earth's perspective today : https://sdo.gsfc.nasa.gov/assets/img/browse/2025/03/21/20250321_000959_1024_0211.jpg and from Parker's perspective as a JHelioviewer movie (courtesy of Yeimy Rivera) : https://drive.google.com/file/d/1llVuw_DAMVSJbyIDuX86zYz884gVWB8F/view?usp=sharing .
Flare Likelihood (CCMC Flare Scoreboard)
----------------------------------------
As of 2025-03-21 at 12:00 UT, the CCMC Flare Scoreboard gave 24-hour average cumulative flare probabilities amounting to 98%, 18% and 2% for GOES C and above, M and above and X-class flares, respectively. The strongest flare observed over the past 24 hours was a GOES M1.2 at 2025-03-20T16:00. A large number of sunspot complexes currently appear on the visible disk, including NOAA ARs 14020-23, 14025-14026, and 14028-14035. Again, Parker will travel across the full visible disk in the coming days.
From the CCMC CME Scoreboard, there is one active Earth-directed CME likely launched at 2025-03-19T00:39 UT (detected 2025-03-19T02:24) with an estimated speed of approx. 417 km/s from an apparent source location at N05E05.The predicted shock arrival at Earth-L1 is at approx. 2025-03-22T16:00 (+/- 7 hours) and the encounter is projected to be a glancing blow. The most conservative geoeffectiveness predictions call for a below-minor event, possibly reaching up to moderate, at most.
------------------
*** Please note that the "arrival time" and "emission time" and associated Tx/Ty coordinates for both are reported in the consensus CSV file. The attached plots show the "arrival time" (location of source at time that plasma will arrive at PSP). See https://docs.google.com/presentation/d/1mz02FU24vqKxxLRaJlyScfAh8gB07iOlBsTHApvhls8/edit#slide=id.p for some discussion on these***.
2025-03-22 (CSV, PDF table of coordinates)
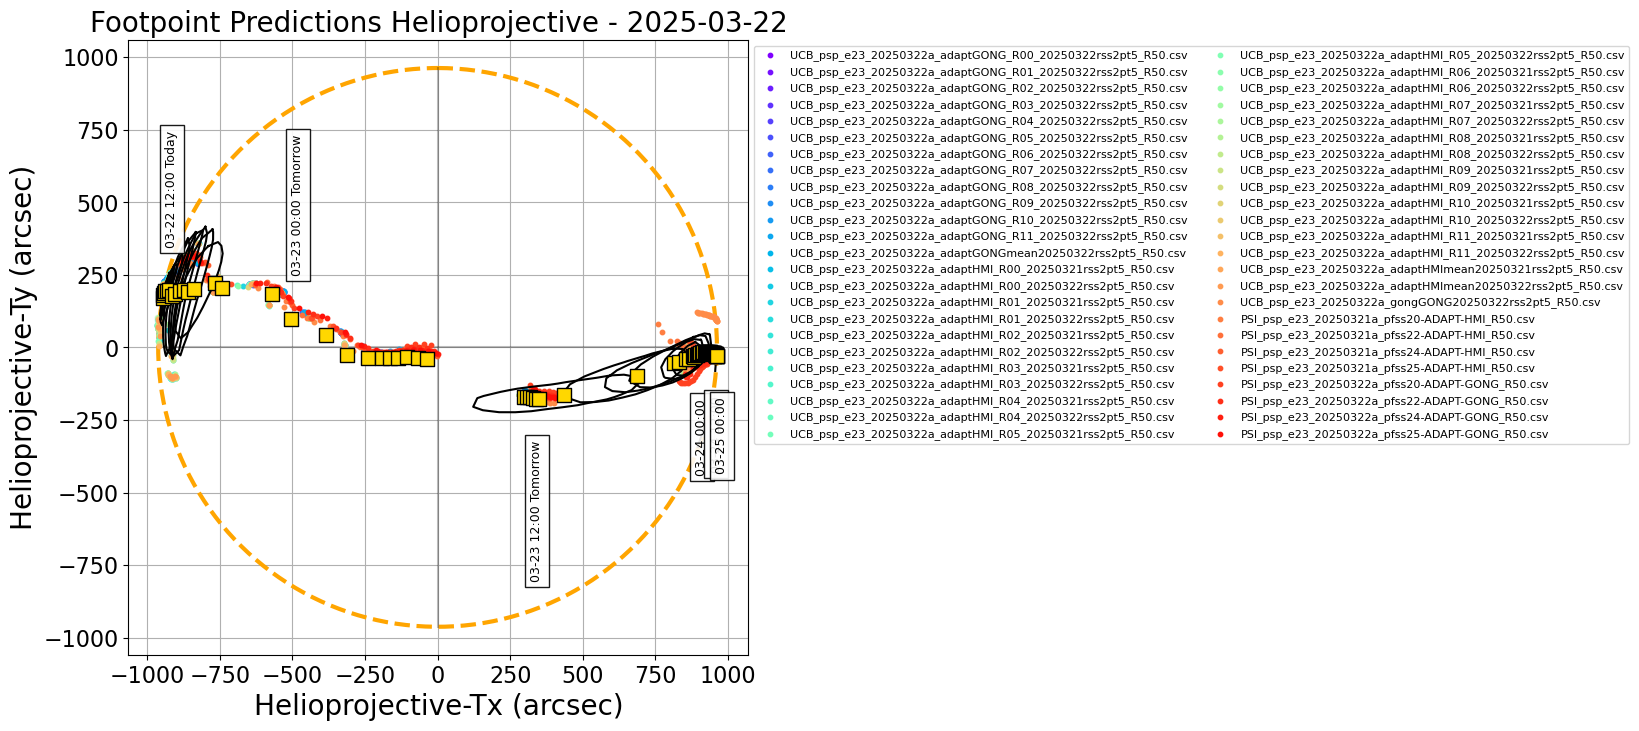
Figure 1.
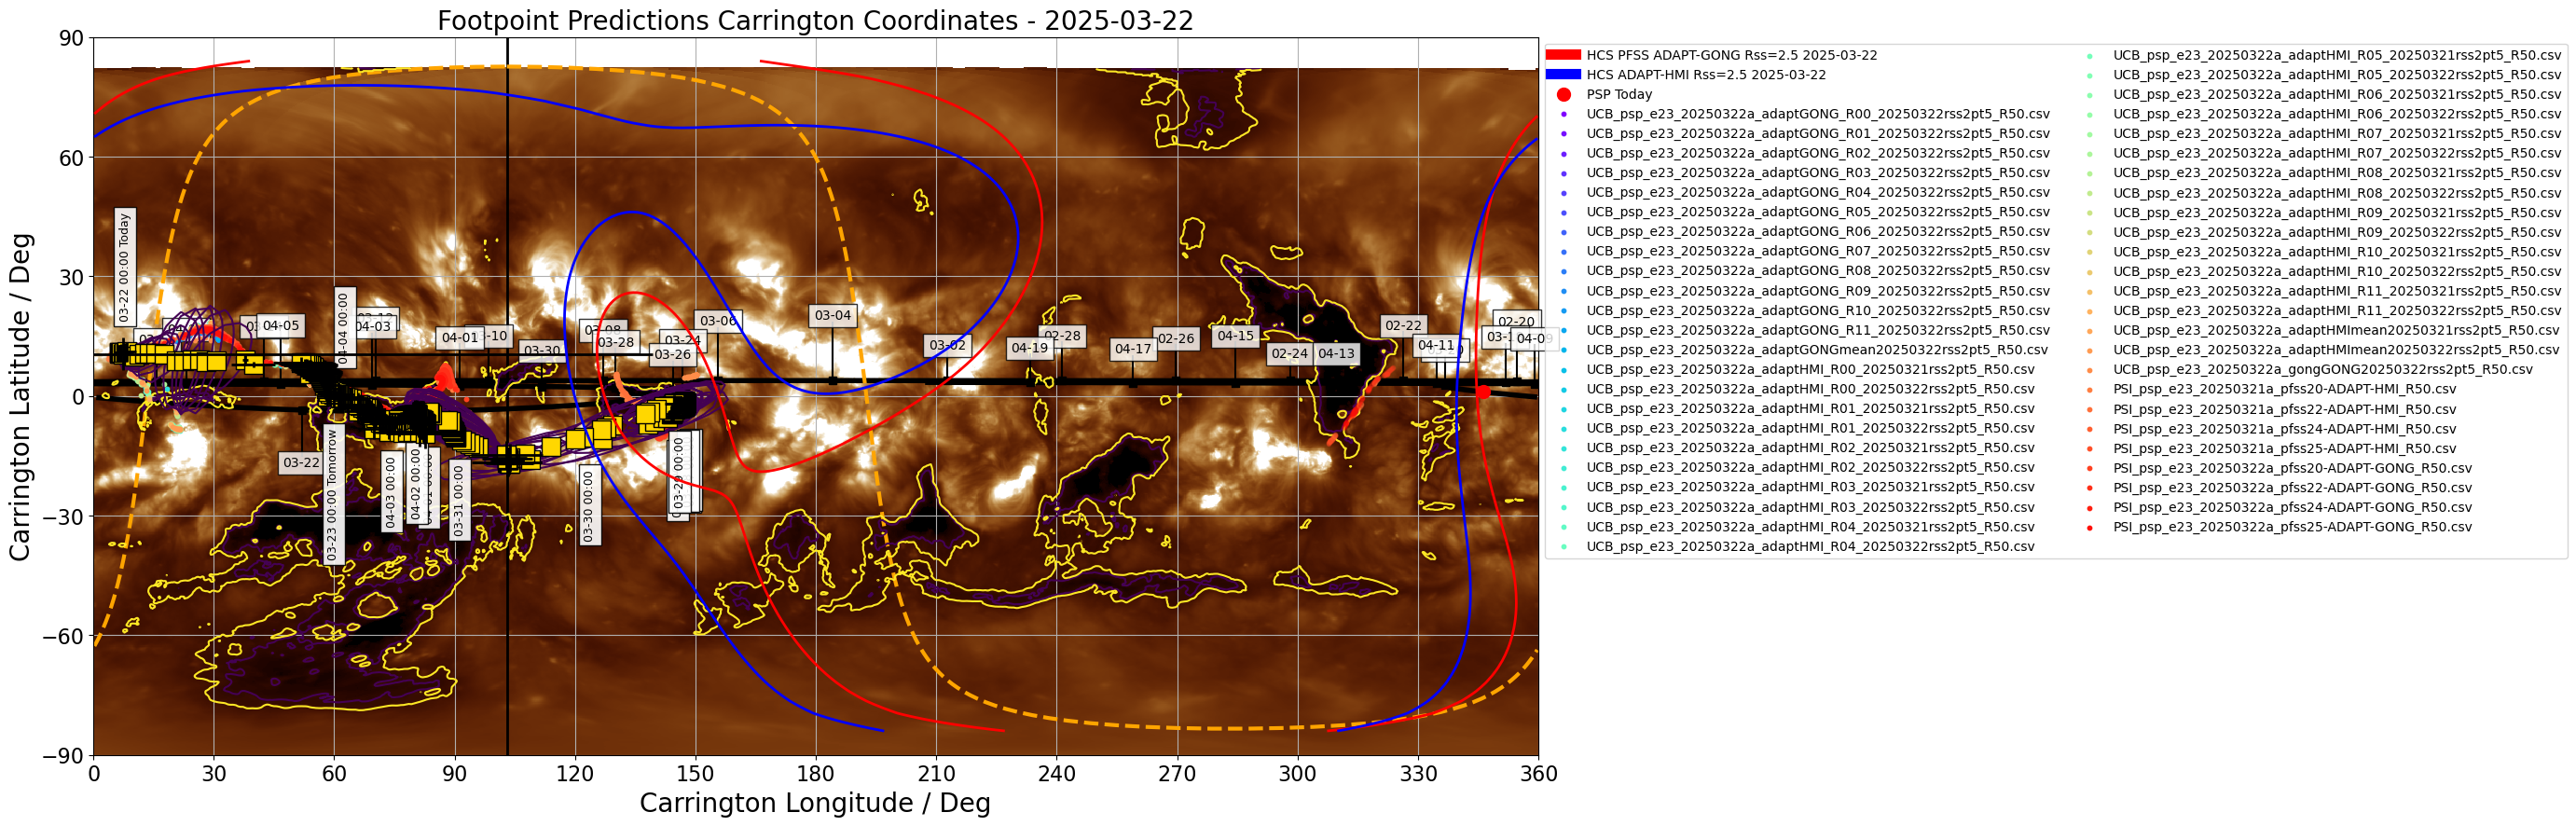
Figure 2.
Figures above show one footpoint per day plotted on the solar disk and in Carrington coordinates (click on figure to zoom and see caption).
The predicted footpoints were kindly provided by the PSP 23rd Perihelion modeling team.
Encounter 23 Prediction update 2/5: 2025/03/22
------------------------------------------------
This is the second of five footpoint predictions issued for Parker Solar Probe Encounter 23, the second time Parker will reach its record-breaking perihelion of 9.86Rs. Perihelion 23 occurs today (2025/03/22) at 22:42 UT (18:42 EDT). This orbit follows the opposite geometry to the prior one with the inbound phase having occurred in the last several days on the far side of the Sun. Today, the footpoints have raced onto the disk over the East limb and are proceeding rapidly across the disk to the West limb over the next several days, traversing the whole visible disk in record time.
Magnetic Connectivity
---------------------
The predominant feature of the prediction remains a large positive polarity equatorial coronal hole which is the predominant feature seen in AIA 211 today nearing disk center (see image and movie links below). Parker is predicted to be sampling this source through today and tomorrow. Late on March 23rd, the footpoints should jump through a current sheet and connect to a negative polarity much smaller coronal hole visible just to the right of disk center in the image and movie linked below. Predictions continue to suggest it will then proceed to follow and eventually corotate with this source as it moves beyond the West limb. Some timing dispersion in the current sheet remains between models but we are confident it will be no earlier than 1200 UT on 3/23, and no later than 1200 UT on 3/24 (and this may be further complicated by a CME which erupted yesterday from active regions under the predicted HCS location, see below). We advise observers to target the large positive coronal hole until at least 1200 UT 3/23 (and potentially for longer as Solar Orbiter and the Earth will both sample wind from this coronal hole in the coming days too). Parker's passage over the West limb is predicted in today's update for 2025/03/25 around 1200UT.
The relevant sources are visible here from the Earth's perspective today : https://sdo.gsfc.nasa.gov/assets/img/browse/2025/03/22/20250322_000959_1024_0211.jpg and from Parker's perspective as a JHelioviewer movie (courtesy of Yeimy Rivera) : https://drive.google.com/file/d/1llVuw_DAMVSJbyIDuX86zYz884gVWB8F/view?usp=sharing .
Flare Likelihood (CCMC Flare Scoreboard)
----------------------------------------
As of 2025-03-22 at 12:00 UT, the CCMC Flare Scoreboard gave 24-hour average cumulative flare probabilities amounting to 99%, 24% and 3% for GOES C and above, M and above and X-class flares, respectively. These are very similar to yesterday’s probabilities. The strongest flare observed over the past 24 hours is still the GOES M1.2 at 2025-03-21T16:00, reported yesterday, from NOAA AR 14034. A large number of sunspot complexes continue to appear on the visible disk, including NOAA ARs 14021, 14023, 14025, 14026, 14028, 14029, 14030 - 14036, 14038, 14039. Parker will travel across the full visible disk in the coming days.
From the CCMC CME Scoreboard, there is one active Earth-directed CME likely launched at 2025-03-21T15:49 UT (detected 2025-03-19T16:00 UT) from a source location N02E07, with a high-uncertainty speed between 1,990 - 3,032 km/s. Uncertainty is due to a data gap in STEREO A COR2 images. The CME is probably related to the M1.2 flare mentioned above. CCMC has issued the Notification ID# 20250321-AL-002 where the lower near-Sun speed is adopted (1,990 km/s). The predicted shock arrival at Earth-L1 is at approx. 2025-03-23T07:30 (+/- 7 hours). The most conservative geoeffectiveness predictions call for a minor event, with a low likelihood for a strong event. Interaction with the previous CME event with expected arrival time at 2025-03-22T16:00 (+/- 7 hours) and a likelihood for a moderate event is unclear at this time.
------------------
*** Please note that the "arrival time" and "emission time" and associated Tx/Ty coordinates for both are reported in the consensus CSV file. The attached plots show the "arrival time" (location of source at time that plasma will arrive at PSP). See https://docs.google.com/presentation/d/1mz02FU24vqKxxLRaJlyScfAh8gB07iOlBsTHApvhls8/edit#slide=id.p for some discussion on these***.
2025-03-23 (CSV, PDF table of coordinates)
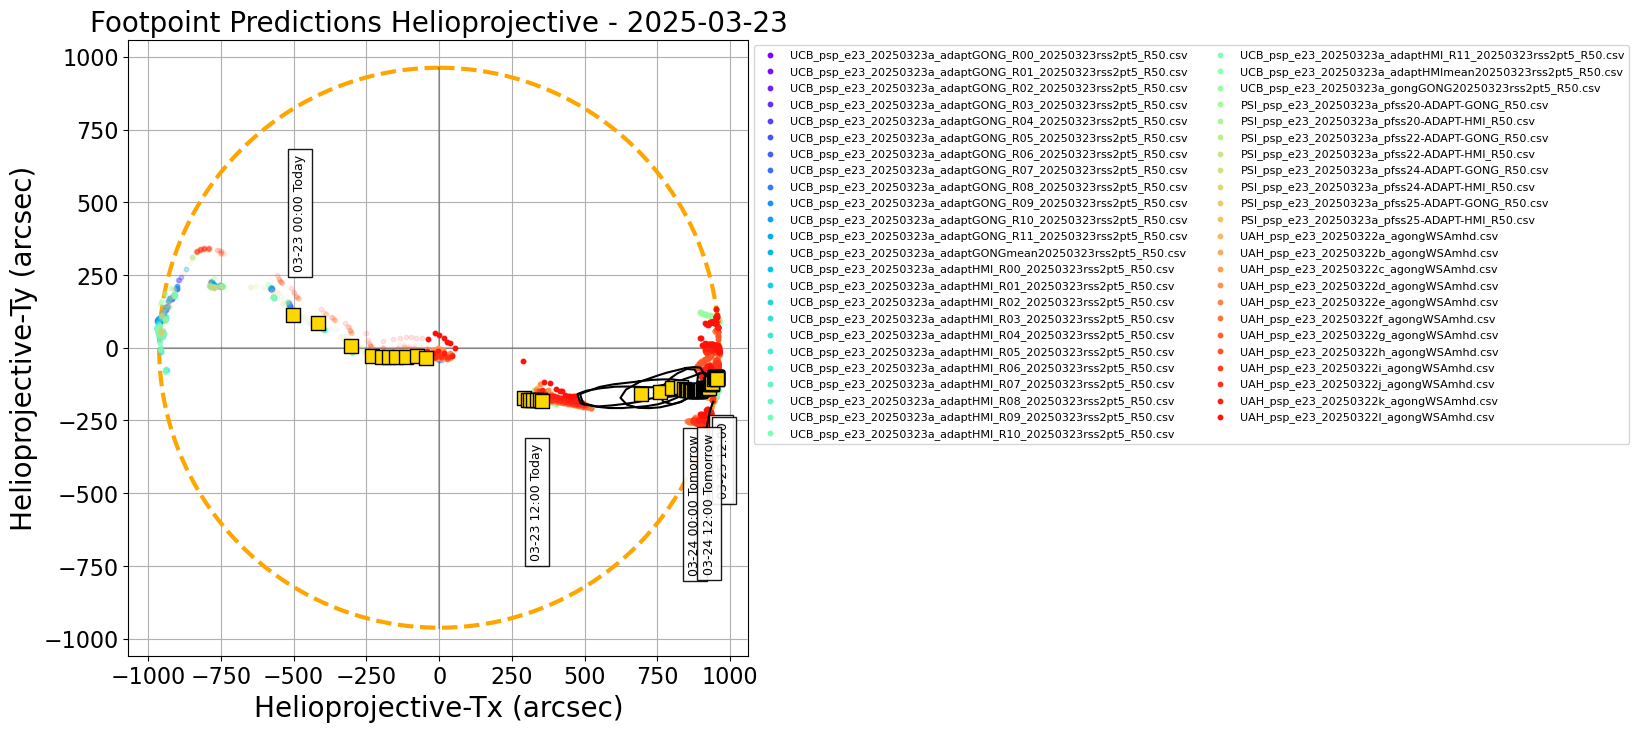
Figure 1.
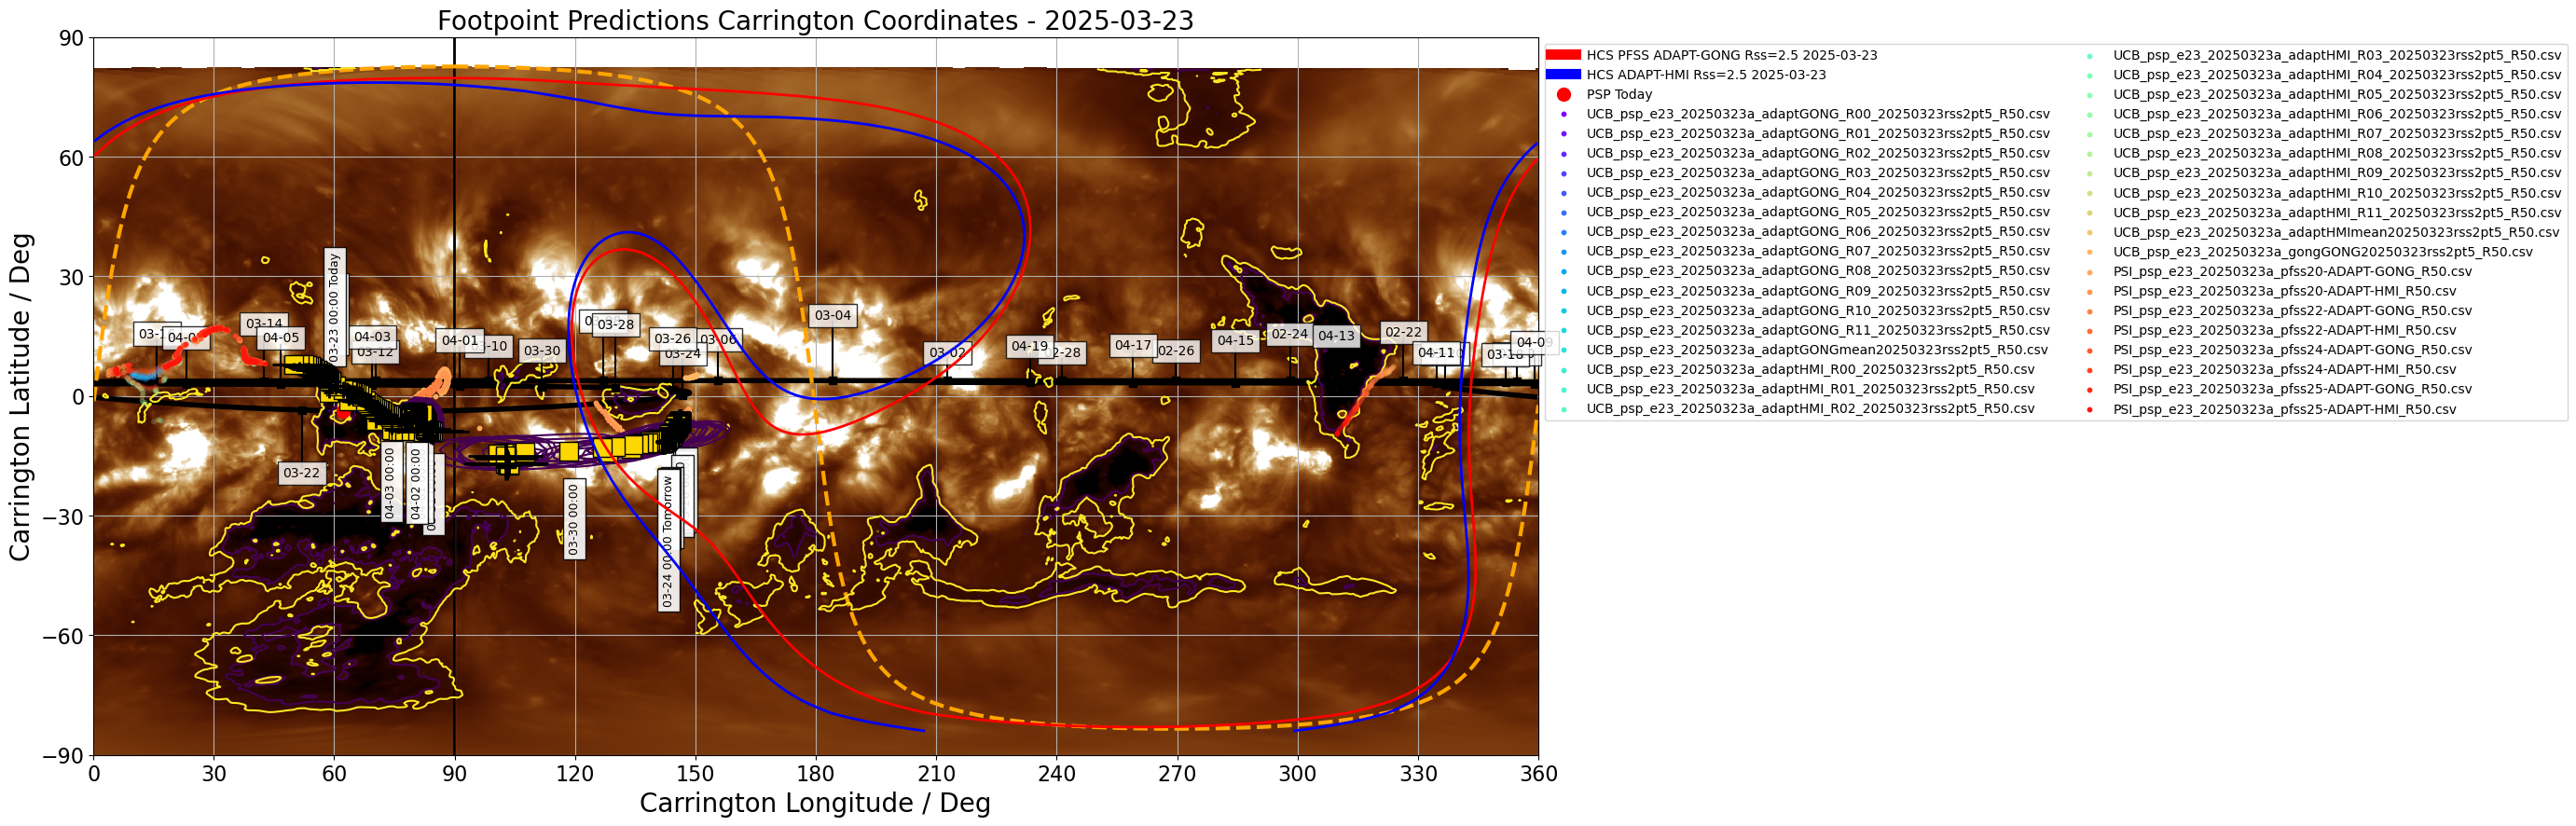
Figure 2.
Figures above show one footpoint per day plotted on the solar disk and in Carrington coordinates (click on figure to zoom and see caption).
The predicted footpoints were kindly provided by the PSP 23rd Perihelion modeling team.
Encounter 23 Prediction update 3/5: 2025/03/23
------------------------------------------------
This is the third of five footpoint predictions issued for Parker Solar Probe Encounter 23, the second time Parker will reach its record-breaking perihelion of 9.86Rs. Perihelion 23 occurred yesterday (2025/03/22) at 22:42 UT (18:42 EDT). Today, the footpoints are near the disk center and proceeding rapidly across the disk (covering almost 1000 arcseconds in just 12 hours today!), and will reach the West limb two days from now (3/25).
Magnetic Connectivity
---------------------
The predominant feature of the prediction remains a large positive polarity equatorial coronal hole which is now close to disk center as seen by AIA 211 today (see image and movie links below). Parker is predicted to be sampling this source until later today when it will traverse the heliospheric current sheet and connect to a negative-polarity much smaller coronal hole still visible as it moves towards the West limb (see image and movie linked below). Predictions continue to suggest this connection will be longer-lived and corotate with this source as it moves beyond the West limb. Although connection to the large positive coronal hole will likely not persist after today, observers may still be interested to target it as Solar Orbiter and the Earth will both sample wind from this coronal hole in the coming days too, and the negative polarity coronal hole is much less apparent due to increasing line of sight effects. Parker's passage over the West limb is predicted in today's update for 2025/03/25 around 1400UT.
The relevant sources are visible here from the Earth's perspective today : https://sdo.gsfc.nasa.gov/assets/img/browse/2025/03/23/20250323_125935_1024_0211.jpg and from Parker's perspective as a JHelioviewer movie (courtesy of Yeimy Rivera) : https://drive.google.com/file/d/1llVuw_DAMVSJbyIDuX86zYz884gVWB8F/view?usp=sharing.
Flare Likelihood (CCMC Flare Scoreboard)
----------------------------------------
As of 2025-03-23 at 12:00 UT, the CCMC Flare Scoreboard gave 24-hour average cumulative flare probabilities amounting to 99%, 25% and 2% for GOES C and above, M and above and X-class flares, respectively. These are virtually unchanged since yesterday’s update. The strongest flare observed over the past 24 hours is a GOES C5.1 at 2025-03-22T17:05. A large number of sunspot complexes continue to appear on the visible disk, including NOAA ARs 14026-14036, 14038 - 14042.
From the CCMC CME Scoreboard, Earth’s encounter may have occurred for the CME reported yesterday (detected 2025-03-19T16:00 UT, from source location N02E07), with a conservative but uncertain speed estimate of 1,990 km/s. The predicted shock arrival at Earth-L1 was at approx. 2025-03-23T07:30 (+/- 7 hours) with a higher likelihood for a minor event. The Kp-index peaked at approx. 4.67 (G1 / minor event) at 2025-03-23T00:00 and is in decline ever since. There are no other reports of Earth-directed CMEs.
------------------
*** Please note that the "arrival time" and "emission time" and associated Tx/Ty coordinates for both are reported in the consensus CSV file. The attached plots show the "arrival time" (location of source at time that plasma will arrive at PSP). See https://docs.google.com/presentation/d/1mz02FU24vqKxxLRaJlyScfAh8gB07iOlBsTHApvhls8/edit#slide=id.p for some discussion on these***.
2025-03-24 (CSV, PDF table of coordinates)
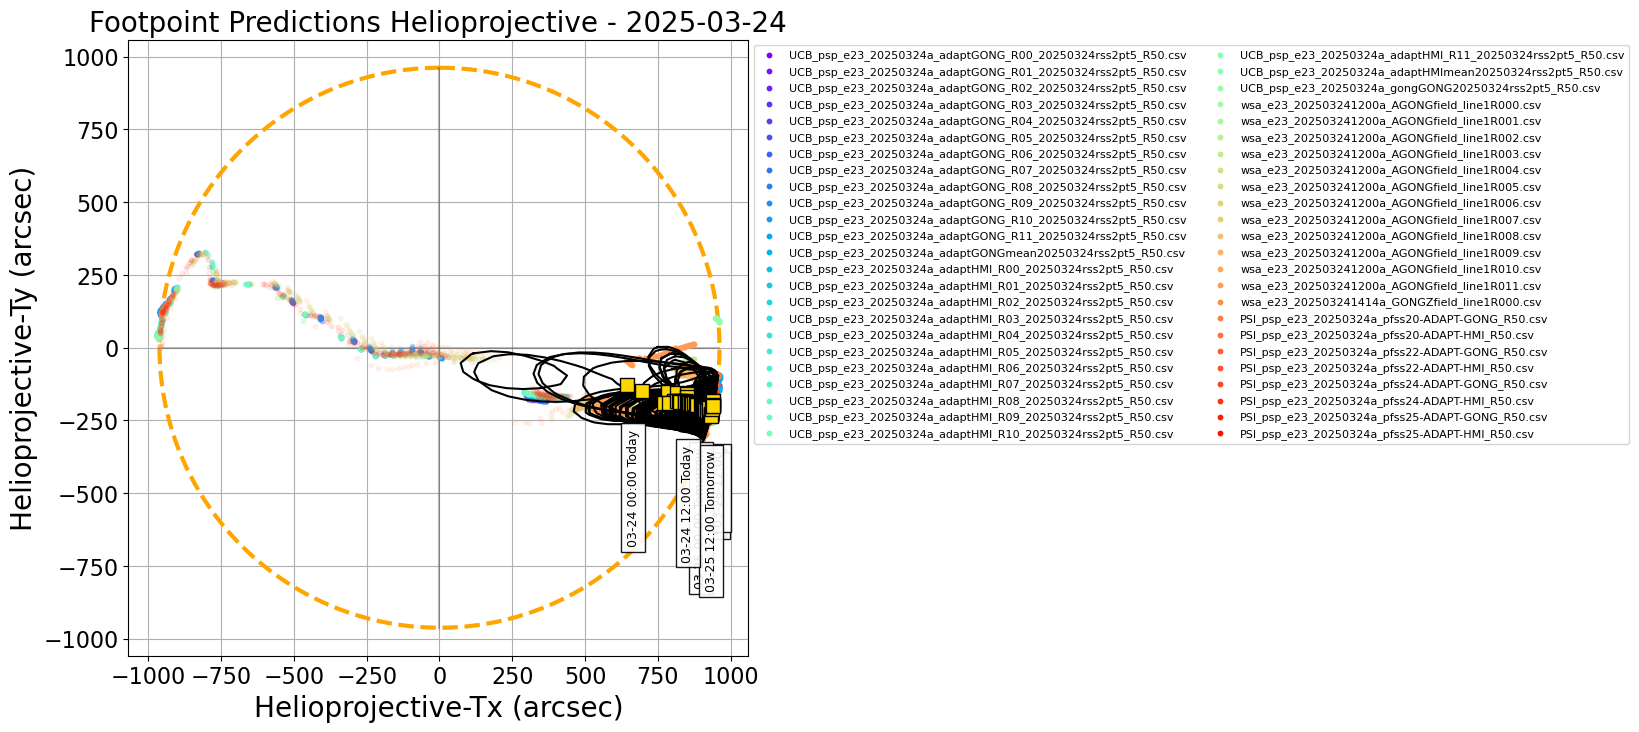
Figure 1.
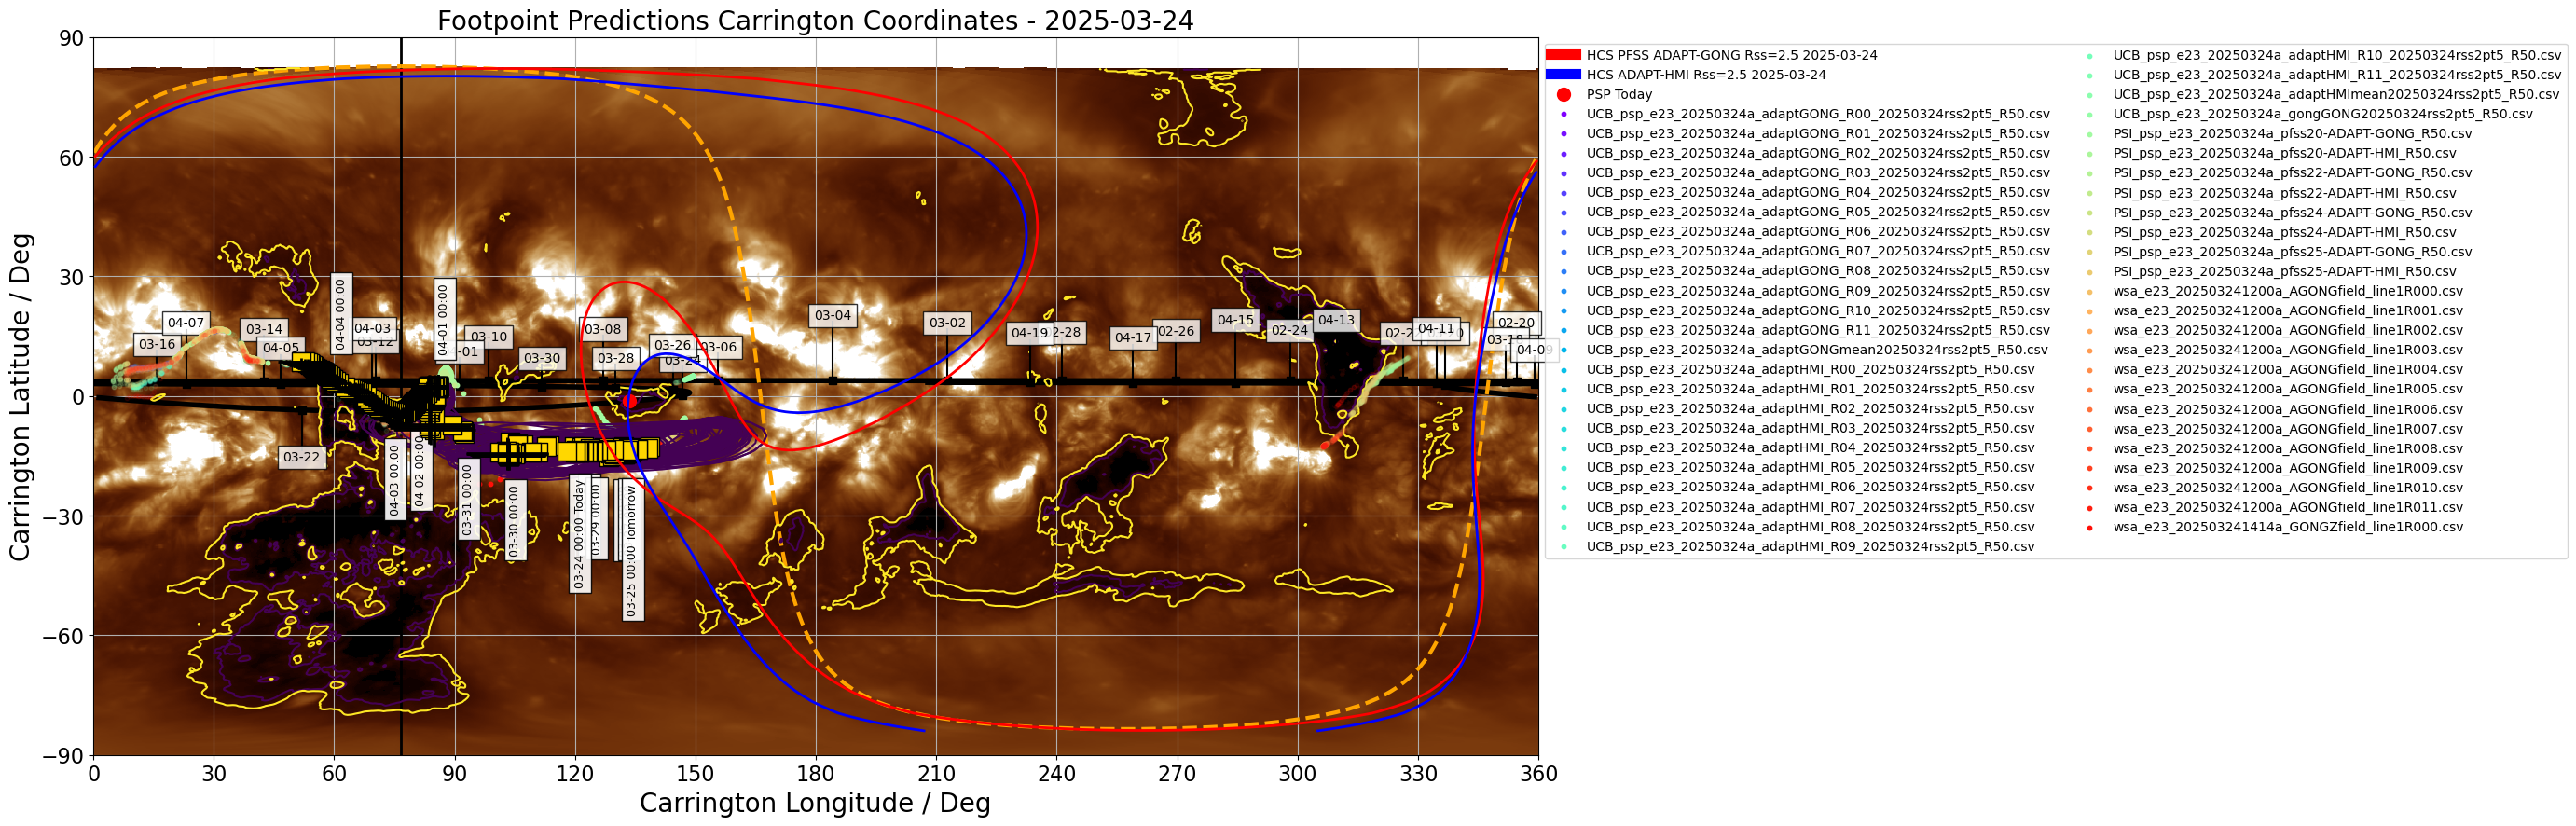
Figure 2.
Figures above show one footpoint per day plotted on the solar disk and in Carrington coordinates (click on figure to zoom and see caption).
The predicted footpoints were kindly provided by the PSP 23rd Perihelion modeling team.
Encounter 23 Prediction update 4/5: 2025/03/24
------------------------------------------------
This is the fourth of five footpoint predictions issued for Parker Solar Probe Encounter 23, the second time Parker will reach its record-breaking perihelion of 9.86Rs. Perihelion 23 occurred on 2025/03/22 at 22:42 UT (18:42 EDT). Today, the footpoints have jumped to near the West limb and are decelerating but are predicted to rotate out of view in the next couple of days (3/26), after we issue our final update.
Magnetic Connectivity
---------------------
Connectivity is now predicted to have migrated westward to a small negative polarity equatorial coronal hole which is now getting close to the West limb and is quite obscured by line of sight effects, but is identifiable as a small V-shaped darkening in STEREO A 195A imagery. Predictions continue to suggest that Parker will corotate with this source as it moves beyond the West limb. The huge equatorial coronal hole (one of the largest of this solar cycle) from the last two days is still close to the disk center as seen by AIA 211A today and remains the most prominent feature on the solar disk (see image and movie links below). As such, observers may still be interested to target it as Solar Orbiter and the Earth will both sample wind from this coronal hole in the coming days too. Parker's passage over the West limb is predicted in today's update for 2025/03/26 around 2100UT.
The relevant sources are visible here from the Earth's perspective today: 20250324_134859_1024_0211.jpg, from STEREO A's persepective at 20250324_113500_n7euA_195.jpg, and from Parker's perspective as a JHelioviewer movie (courtesy of Yeimy Rivera).
Flare Likelihood (CCMC Flare Scoreboard)
----------------------------------------
As of 2025-03-24 at 12:00 UT, the CCMC Flare Scoreboard gave 24-hour average cumulative flare probabilities amounting to 98%, 14% and 5% for GOES C and above, M and above and X-class flares, respectively, showing little difference since yesterday’s update. The strongest flare observed over the past 24 hours was a GOES C4.6 at 2025-03-23T14:18. A large number of sunspot complexes continue to appear on the visible disk, including NOAA ARs 14028, 14029, 14032-14036, and 14038-14042.
From the CCMC CME Scoreboard, there does not seem to be an active Earth-directed CME at this time. The geomagnetic storm levels are kept below minor but slightly elevated (Kp ~4) after 00:00UT on 2025-03-24 compared to much of the day on 2025-03-23.
------------------
*** Please note that the "arrival time" and "emission time" and associated Tx/Ty coordinates for both are reported in the consensus CSV file. The attached plots show the "arrival time" (location of source at time that plasma will arrive at PSP). See this slide deck for some discussion on these***.
2025-03-25 (CSV, PDF table of coordinates)
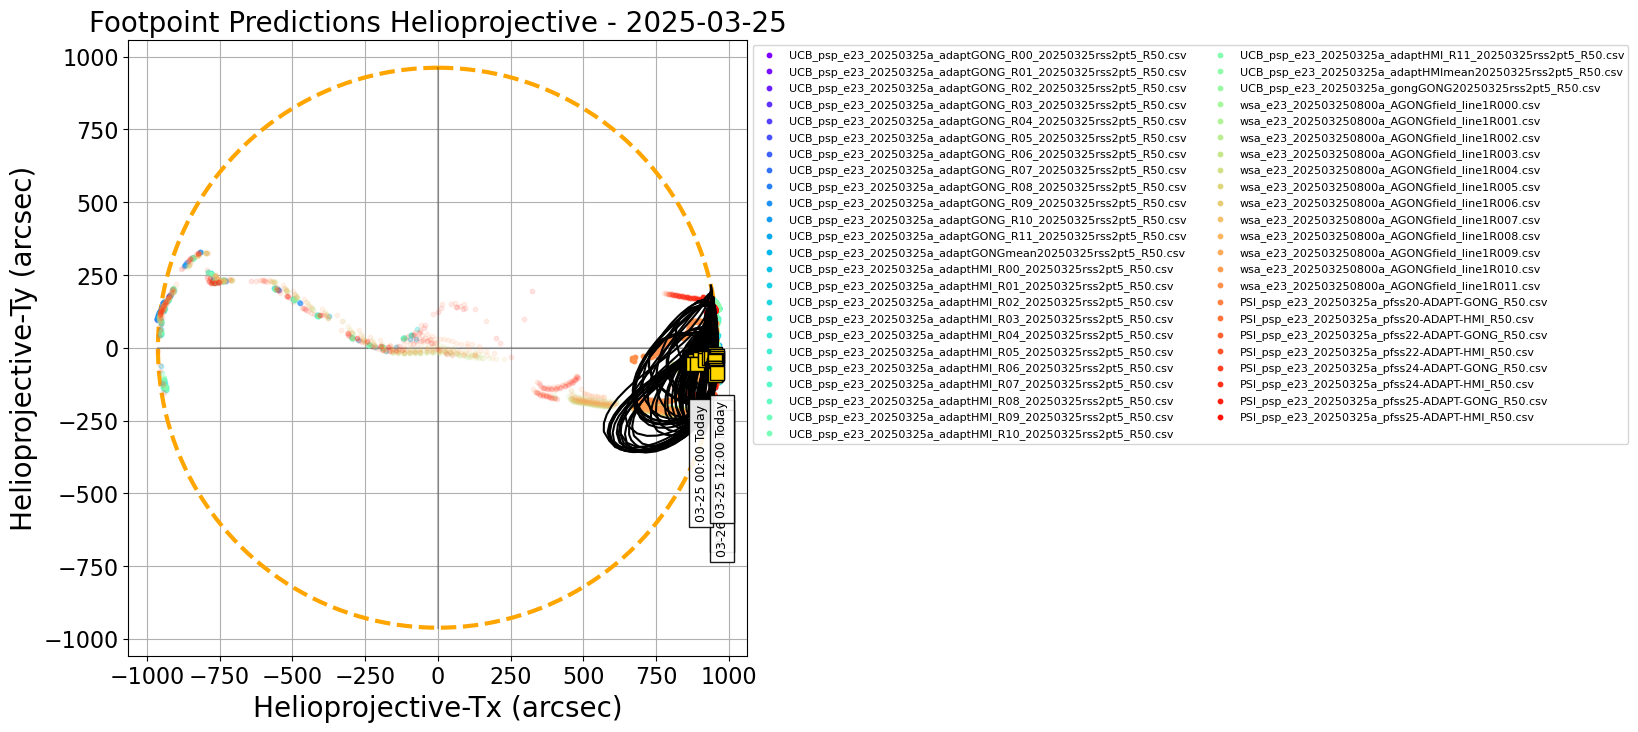
Figure 1.
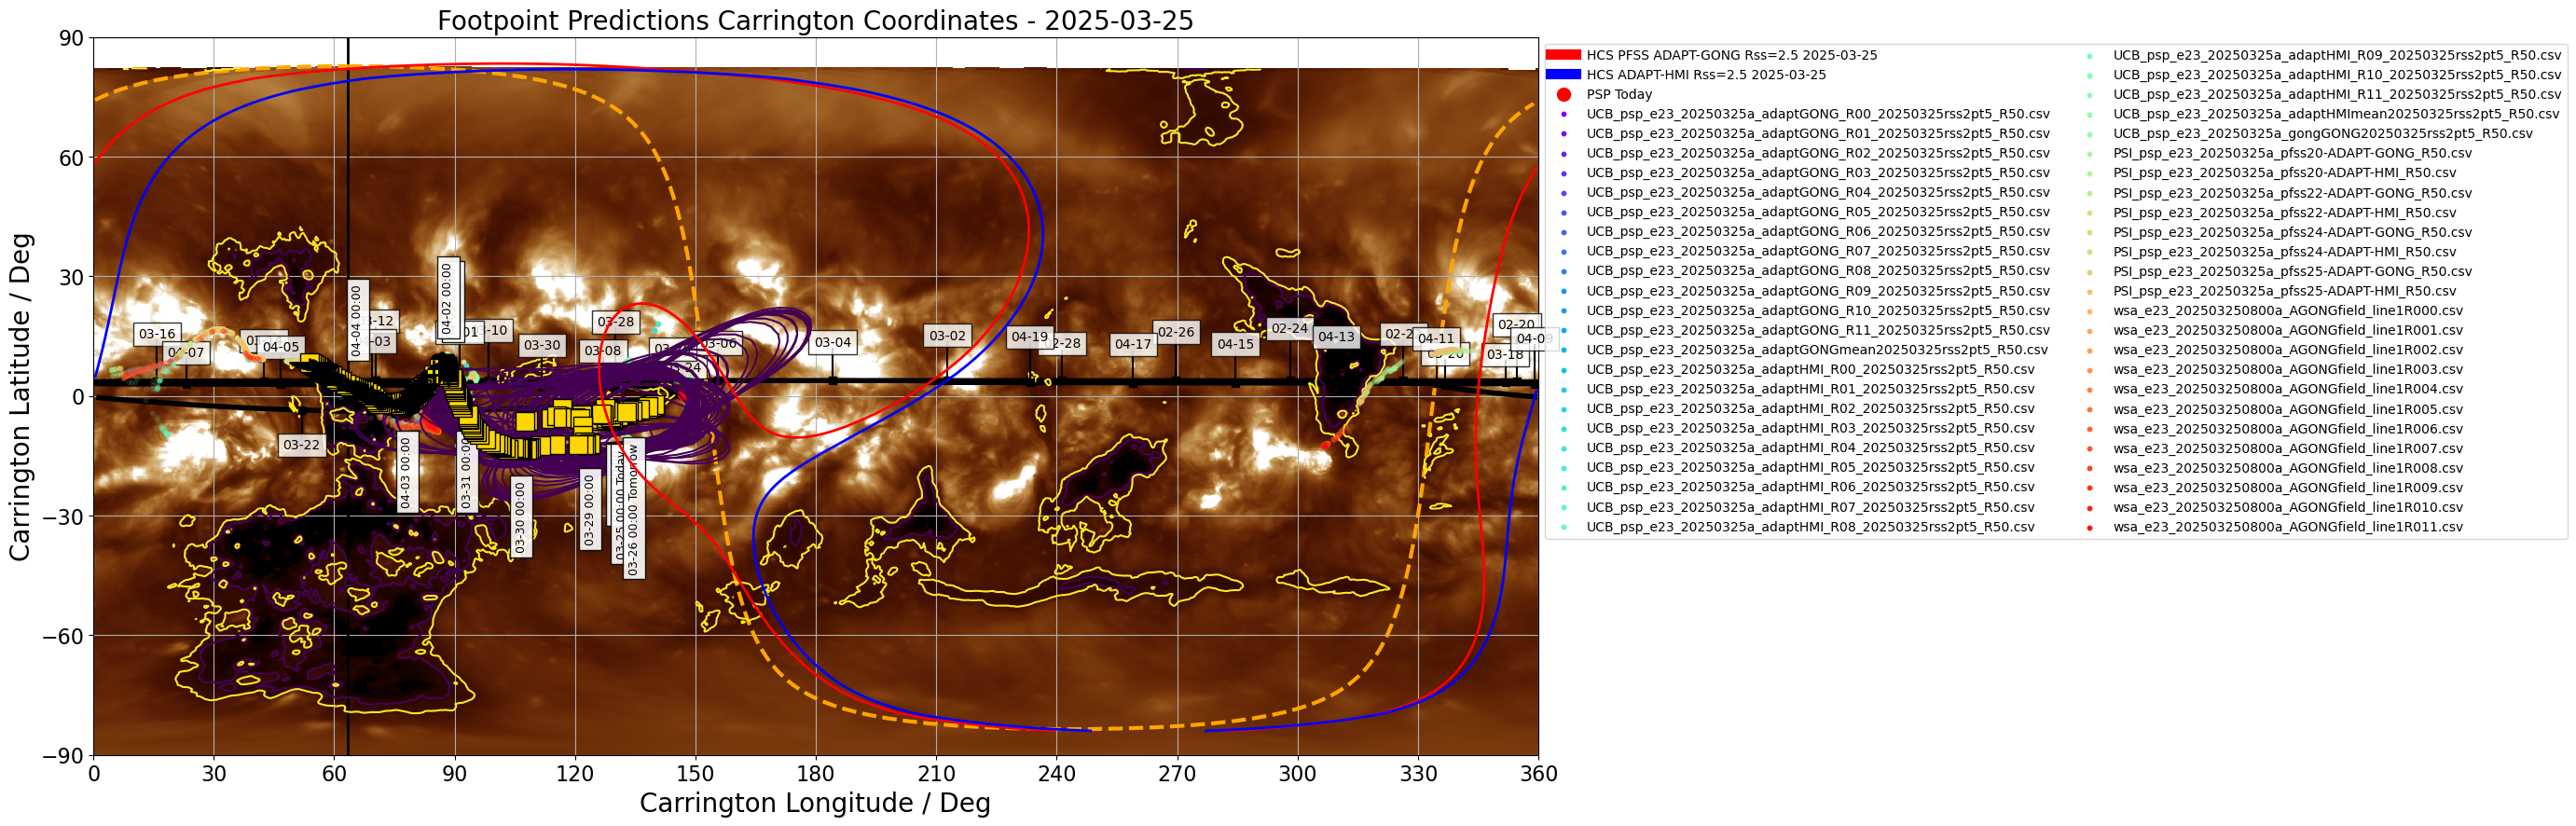
Figure 2.
Figures above show one footpoint per day plotted on the solar disk and in Carrington coordinates (click on figure to zoom and see caption).
The predicted footpoints were kindly provided by the PSP 23rd Perihelion modeling team.
Encounter 23 Prediction update 5/5: 2025/03/25
------------------------------------------------
This is the last of five footpoint predictions issued for Parker Solar Probe Encounter 23, the second time Parker will reach its record-breaking perihelion of 9.86Rs. Perihelion 23 occurred on 2025/03/22 at 22:42 UT (18:42 EDT). Today, the footpoints remain tied to a small negative polarity equatorial coronal hole just cresting the West limb now. Footpoints are expected to rotate out of view in the next 24 hours.
Magnetic Connectivity
---------------------
Connectivity is now predicted remained attached to a small negative polarity equatorial coronal hole which is now very close to the West limb and essentially not visible from Earth, but is identifiable as a small V-shaped darkening in STEREO A EUVI 195 A imagery. Predictions continue to suggest that Parker will corotate with this source as it moves beyond the West limb. The huge equatorial coronal hole (one of the largest of this solar cycle) from the last two days is now just to the right of the disk center as seen by AIA 211 A today and remains the most prominent feature on the solar disk (see image and movie links below). As such, observers may still be interested to target it as Solar Orbiter and the Earth will both sample wind from this coronal hole in the coming days too. Parker's passage over the West limb is predicted in today's update for 2025/03/26 around 20:00 UT.
The relevant sources are visible here from the Earth's perspective today: 20250325_131959_1024_0211.jpg, from STEREO A's persepective at 20250325_130500_n7euA_195.jpg, and from Parker's perspective as a JHelioviewer movie (courtesy of Yeimy Rivera).
Flare Likelihood (CCMC Flare Scoreboard)
----------------------------------------
As of 2025-03-25 at 12:00 UT, the CCMC Flare Scoreboard gave 24-hour average cumulative flare probabilities amounting to 98%, 9% and 2% for GOES C and above, M and above and X-class flares, respectively, slightly decreased since yesterday’s update. The strongest flare observed over the past 24 hours was a GOES C9.5 at 2025-03-25T12:29:00. A significant -but smaller than previous updates- number of sunspot complexes appear on the visible disk, including NOAA ARs 14028, 14033 - 14035, 14036 and 14038 - 14042.
From the CCMC CME Scoreboard, there does not seem to be an active Earth-directed CME at this time. The geomagnetic storm levels are kept below minor and have further decreased since yesterday’s update, with an average Kp ~3.
------------------
*** Please note that the "arrival time" and "emission time" and associated Tx/Ty coordinates for both are reported in the consensus CSV file. The attached plots show the "arrival time" (location of source at time that plasma will arrive at PSP). See slide deck for some discussion on these***.
Date and arrival time of plasma parcel at PSP, consensus carrington longitude (deg), latitude (deg), error in longitude, error in latitude, on-disk position of predicted source in X and Y (arcseconds) at arrival time, date and emission time of plasma parcel at the source, on-disk position of predicted source at time parcel is emitted. Each row is the updated source location each hour.
The consensus is generated by forming a distribution of footpoint predictions from all modelers for each hour period, and attempting to fit a Kent distribution. If the fitting fails, the median in longitude and latitude are quoted. If the fitting is successful, the quoted errors are formed by drawing random samples from the fitted distribution and computing the standard deviation in longitude and latitude of those samples. If the fitting fails, the quoted errors are the standard deviation in the longitude and latitude from the raw distribution of predictions. The full shape of the distribution is described by black contours in the associated plots on this website. More details about the procedure can be found at the following preprint of Badman et al. (2023) "Prediction and Verification of Parker Solar Probe Solar Wind Sources at 13.3Rs"
Please note the carrington coordinates (lon,lat) are valid from the quoted timestamp (in UTC) until the next timestamp. The helioprojective coordinates quoted (HP-Tx, HP-Ty) are computed from the carrington coordinate at the quoted timestamp (e.g. midnight UTC each day) and so are valid instantaneously at this time but will corotate with the Sun until the next quoted timestamp. For a discussion of the subtle difference in emission and arrival time and why both are included please see the slide deck.
Individual model prediction tables of coordinates may be found in a Public DropBox. Files in the Public DropBox have three-letter identifiers indicating the associated model (see below).
Three-letter designation for Public DropBox: UCB. Kindly provided by Sam Badman. The model is a simple ballistic propagation from PSP down to the source surface assuming slow wind 360km/s, and then tracing this sub-PSP trajectory through a PFSS model to get footpoints at the photosphere. The source surface height here is 2.5Rs. The PFSS model is generated using various ADAPT maps with GONG and HMI as input, and the model is run using the open source pfsspy package. A more detailed explanation of the model and comparison to PSP E1 results are given here.
Three-letter designation for Public DropBox: PSI. Kindly provided by Pete Riley. For these predictions, PSI is using a combination of modeling approaches, including PFSS solutions, empirically-based polytropic MHD solutions, and a more sophisticated approach that includes the effects of waves and turbulence to heat the corona and the WKB approximation for wave pressures to accelerate the solar wind. Additionally, boundary conditions are derived from both HMI and ADAPT synoptic magnetograms. Together, these allow us to generate a rich set of ensemble realizations from which to make our optimal prediction, as well as pool them with other teams’ forecasts to derive a hyper-ensemble prediction.
Three-letter designation for Public DropBox: wsa. Kindly provided by Shaela Jones. The Wang-Sheeley-Arge (WSA) model is a combined empirical and physics-based model of the corona and solar wind. The coronal portion of the Wang-Sheeley-Arge (WSA) model is comprised of the Potential Field Source Surface (PFSS) and Schatten Current Sheet (SCS) models, where the output of the PFSS model serves as input to the SCS model. The solar wind portion of WSA consists of a simple 1-D kinematic propagation code that takes stream interactions into account in an ad-hoc fashion. It provides predictions of the solar wind speed and interplanetary magnetic field IMF polarity at any specified point in the inner heliosphere. The WSA model can use global maps of the photospheric magnetic flux measurements from a number of sources as its inner boundary condition; here we are using an ensemble of maps from the Air Force Data Assimilative Photospheric Flux Transport (ADAPT) model, based on input GONG magnetograms.
UAH predictions come from the University of Alabama, Huntsville Multiscale Fluid-Kinetic Simulation Suite (MS-FLUKSS, Pogorelov et al. (2014); Pogorelov (2023); Singh et al. (2022)), which can solve the Reynolds-averaged ideal MHD equations for the mixture of thermal and nonthermal solar wind ions coupled with the kinetic Boltzmann equation describing the transport of neutral atoms. An adaptive mesh refinement technique can be employed for efficient high-resolution calculations. The MS-FLUKSS heliospheric MHD model is coupled with the WSA model (Kim et al., 2020), which uses both ADAPT-GONG and ADAPT-HMI input magnetograms, with the PFSS source surface height and the WSA outer boundary at 2.5 and 10 solar radii, respectively. Hence, field line tracing is performed through the MHD domain down to 10 solar radii instantaneously at approximately 1 hour cadence, where the origin of the field line on the photosphere is already known, as described for WSA.
see Prediction and Verification of Parker Solar Probe Solar Wind Sources at 13.3Rs, Badman et al. (2023)
