

Refer to PSP 20th Perihelion Campaign page.
2024-06-28 (CSV, PDF table of coordinates)
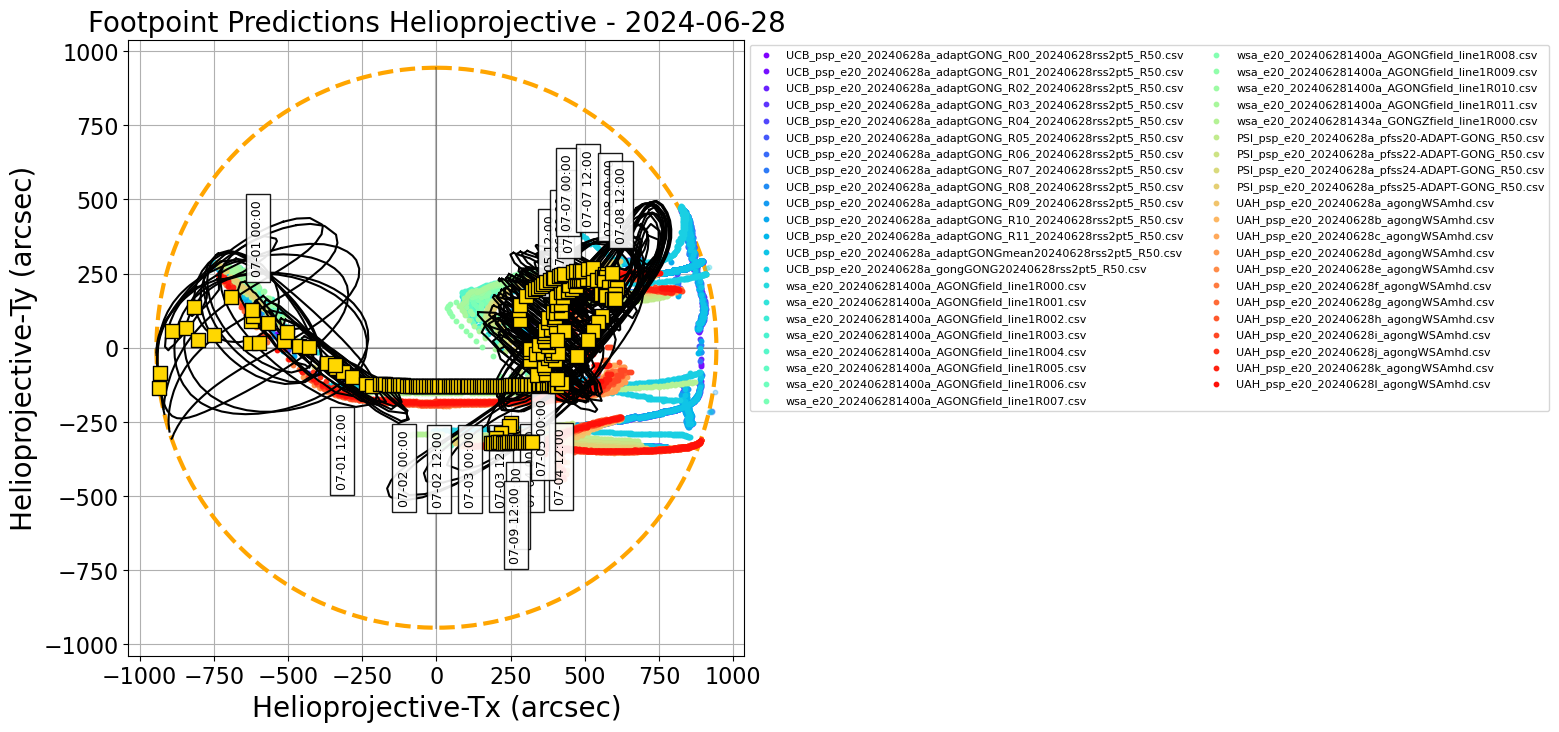
Figure 1.
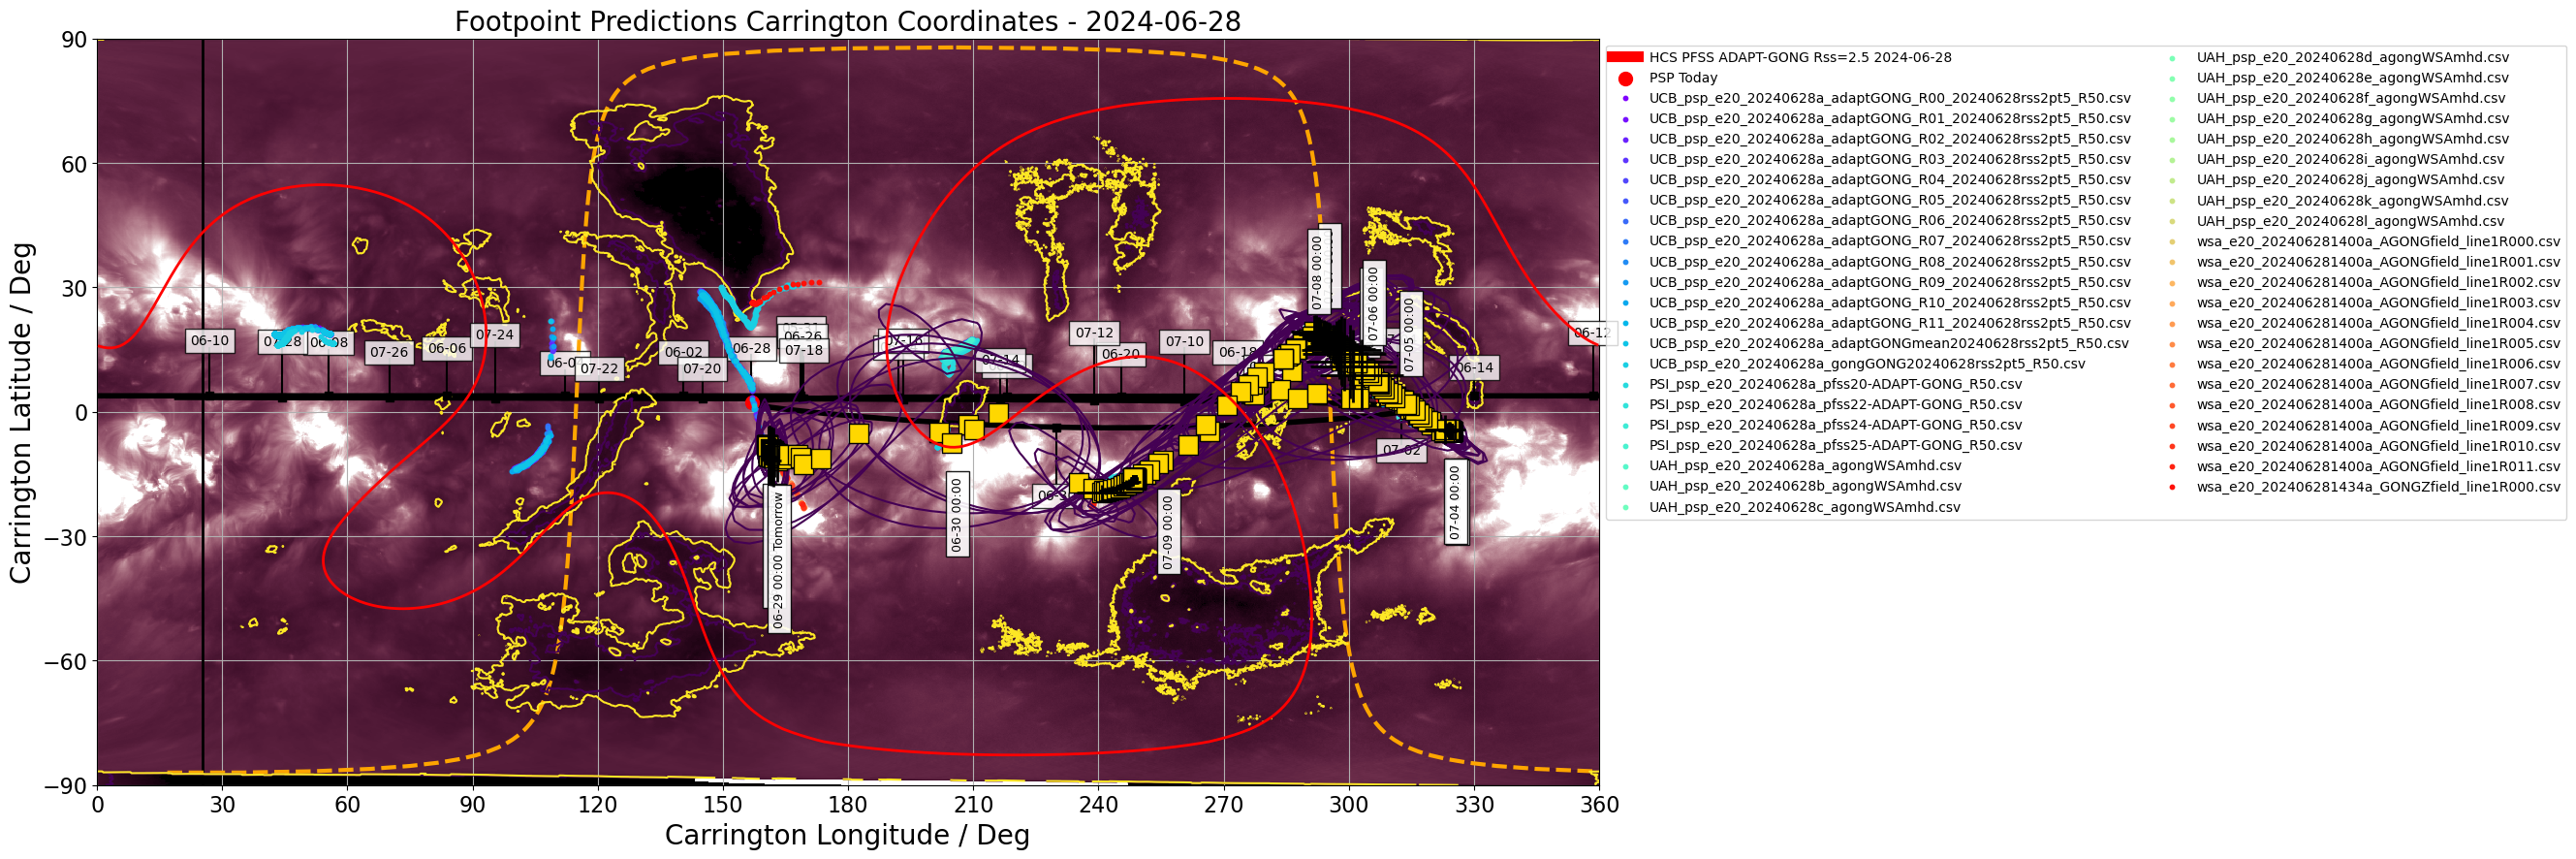
Figure 2.
Figures above show one footpoint per day plotted on the solar disk and in Carrington coordinates (click on figure to zoom and see caption).
The predicted footpoints were kindly provided by the PSP 20th Perihelion modeling team.
Encounter 20 Prediction update 1/3: 2024/06/28
------------------------------------------------
This is the first of three footpoint predictions issued for Parker Solar Probe Encounter 20, which reaches an 11.4Rs perihelion on June 30th . The inbound portion of the orbit is on the solar far side but shortly after perihelion the spacecraft will emerge through the plane of the sky over the East limb and move rapidly prograde on disk from July 1 onwards. This first prediction is issued prior to the footpoints coming on disk and two follow ups on Monday July 1 and Tuesday July 2 will provide updates on the on disk progression.
Magnetic Connectivity
---------------------
Footpoints are predicted to emerge around 1700UT on June 30th connecting to a mid-northern latitude coronal hole predicted to emerge on disk at that time (although these longitudes are currently behind the east limb and quite uncertain. From end of day June 30th through July 1 footpoints move rapidly on disk and jump to an active region complex around -4 degrees latitude visible in the south east quadrant of the sun today in AIA (https://sdo.gsfc.nasa.gov/assets/img/browse/2024/06/28/20240628_000959_1024_0211.jpg) potentially running along a coronal hole corridor to get there. At this point the spacecraft angular velocity has slowed and the footpoints corotate with this location on disk proceeding westwards across the central meridian until July 4th.
Flare Likelihood (CCMC Flare Scoreboard)
----------------------------------------
As of 2024-06-28 at 00:00 UT, the CCMC Flare Scoreboard gave 24-hour average cumulative flare probabilities amounting at 93%, 34% and 8% for GOES C and above, M and above and X-class flares, respectively. A number of sunspot complexes currently appear on the visible disk, namely NOAA ARs 13719 - 13730. Average flare probabilities over the past several hours show a slightly decreasing trend. Sunspot complexes east of the central meridian will be of most relevance to Parker Solar Probe observations.
From the CCMC CME Scoreboard, there is one active Earth-directed CME launched 2024-06-25T23:48 UT with an estimated near-Sun speed of approx. 355 km/s. It is expected to reach Earth at 2024-06-29T14:00 UT but is not expected to trigger a major geomagnetic event, and is unlikely to be encountered by Parker Solar Probe.
*** Please note that the "arrival time" and "emission time" and associated Tx/Ty coordinates for both are reported in the consensus CSV file. The attached plots show the "arrival time" (location of source at time that plasma will arrive at PSP). See https://docs.google.com/presentation/d/1mz02FU24vqKxxLRaJlyScfAh8gB07iOlBsTHApvhls8/edit#slide=id.p for some discussion on these***.
2024-07-01 (CSV, PDF table of coordinates)
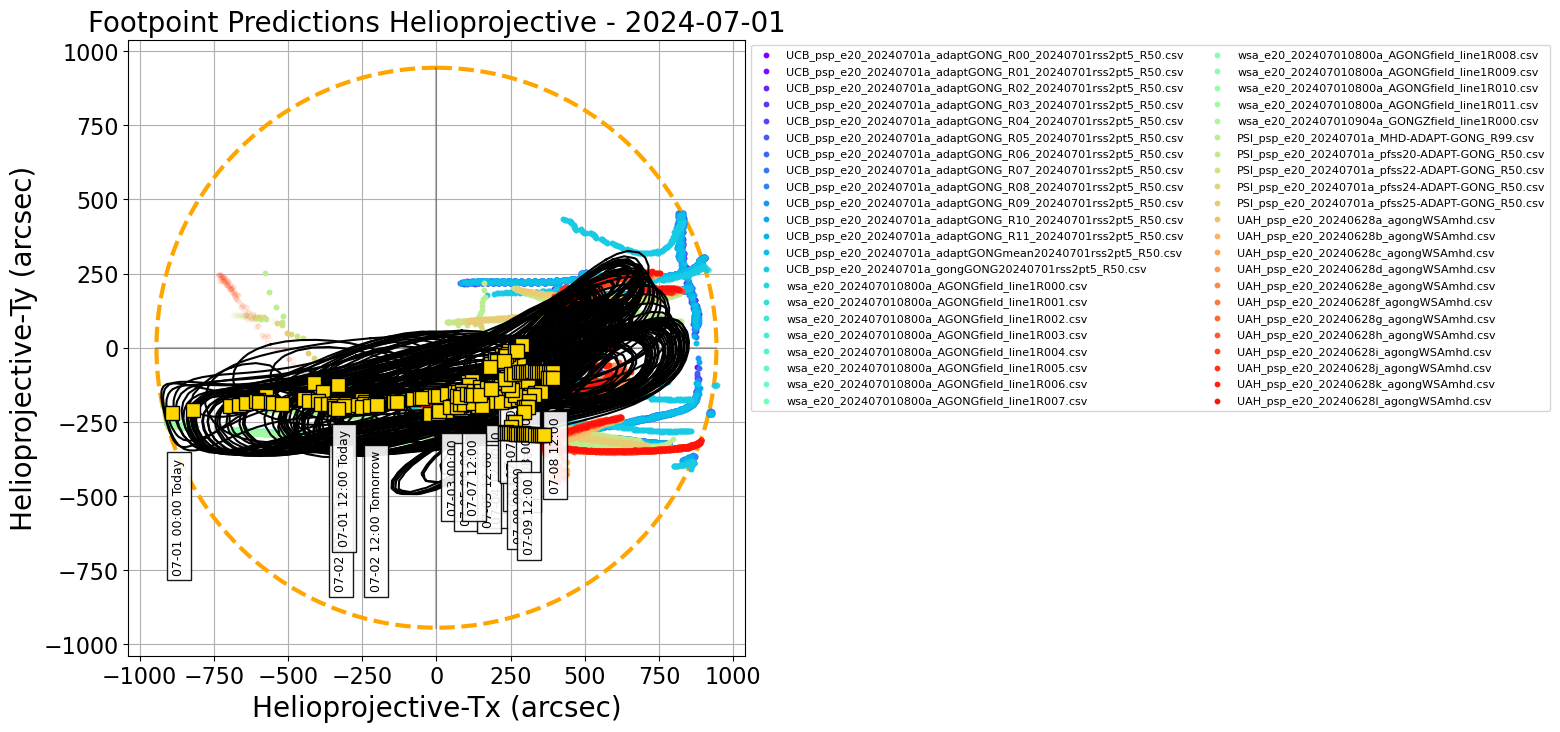
Figure 1.
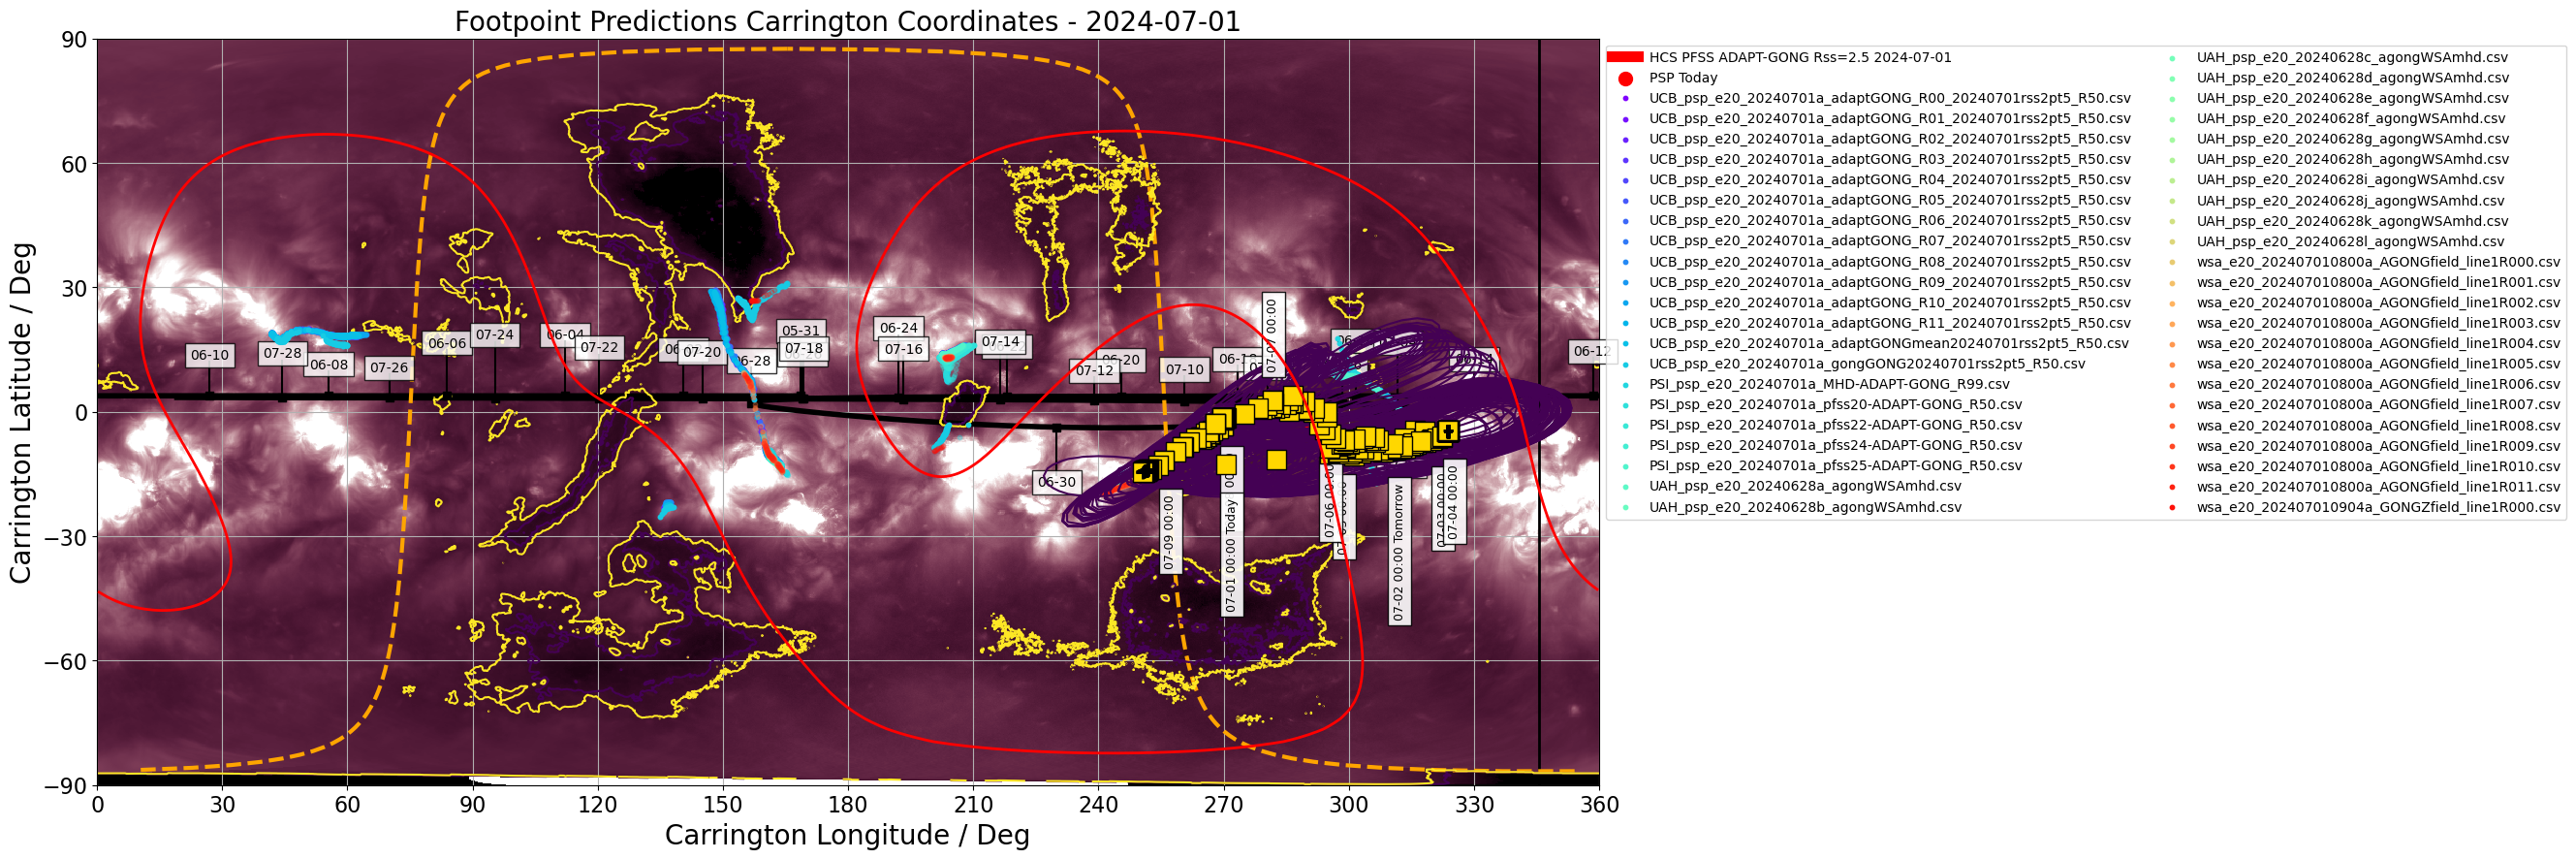
Figure 2.
Figures above show one footpoint per day plotted on the solar disk and in Carrington coordinates (click on figure to zoom and see caption).
The predicted footpoints were kindly provided by the PSP 20th Perihelion modeling team.
Encounter 20 Prediction update 2/3: 2024/07/01
------------------------------------------------
This is the second of three footpoint predictions issued for Parker Solar Probe Encounter 20, which reached an 11.4Rs perihelion on June 30th . The inbound portion of the orbit was on the solar far side but shortly after perihelion the spacecraft emerged over the East limb and has moved rapidly prograde on disk and is nearing co-rotation near disk-center. This second prediction is issued following this on disk progression and a final follow will be sent tomorrow, July 2.
Magnetic Connectivity
---------------------
The consensus target at the start of today is a southern mid-latitudes near the limb without a clear coronal hole candidate in EUV (https://sdo.gsfc.nasa.gov/assets/img/browse/2024/07/01/20240701_000959_1024_0211.jpg). Some ensemble members point to a Northern mid-latitude coronal hole closer to the central meridian which does appear in EUV. In both cases, the connection is short lived and jumps to the cluster of active regions seen near disk center in the same image by end of day 07/01 UT (AR13733, AR13729, AR731). Beyond today, footpoints progress more slowly and tend to corotate with these active regions gradually towards the West limb. Later (July 6 on), Parker's slowing angular motion takes it back eastwards and crosses over the coronal holes from the start of today's predictions again.
Flare Likelihood (CCMC Flare Scoreboard)
----------------------------------------
As of 2024-07-01 at 12:00 UT, the CCMC Flare Scoreboard gave 24-hour average cumulative flare probabilities amounting at 99%, 35% and 5% for GOES C and above, M and above and X-class flares, respectively. A significant number of sunspot complexes currently appear on the visible disk, namely NOAA ARs 13719 - 13735. The sunspot group near the central meridian south of the equator are of most relevance to Parker observations today.
From the CCMC CME Scoreboard, there is one active Earth-directed CME launched 2024-06-30T03:48 UT with an estimated speed of approx. 309 km/s. It is expected to reach Earth at 2024-07-04T10:00 UT but is not expected to trigger a major geomagnetic event. It is possible Parker is currently measuring solar wind following behind this CME.
*** Please note that the "arrival time" and "emission time" and associated Tx/Ty coordinates for both are reported in the consensus CSV file. The attached plots show the "arrival time" (location of source at time that plasma will arrive at PSP). See https://docs.google.com/presentation/d/1mz02FU24vqKxxLRaJlyScfAh8gB07iOlBsTHApvhls8/edit#slide=id.p for some discussion on these***.
2024-07-02 (CSV, PDF table of coordinates)
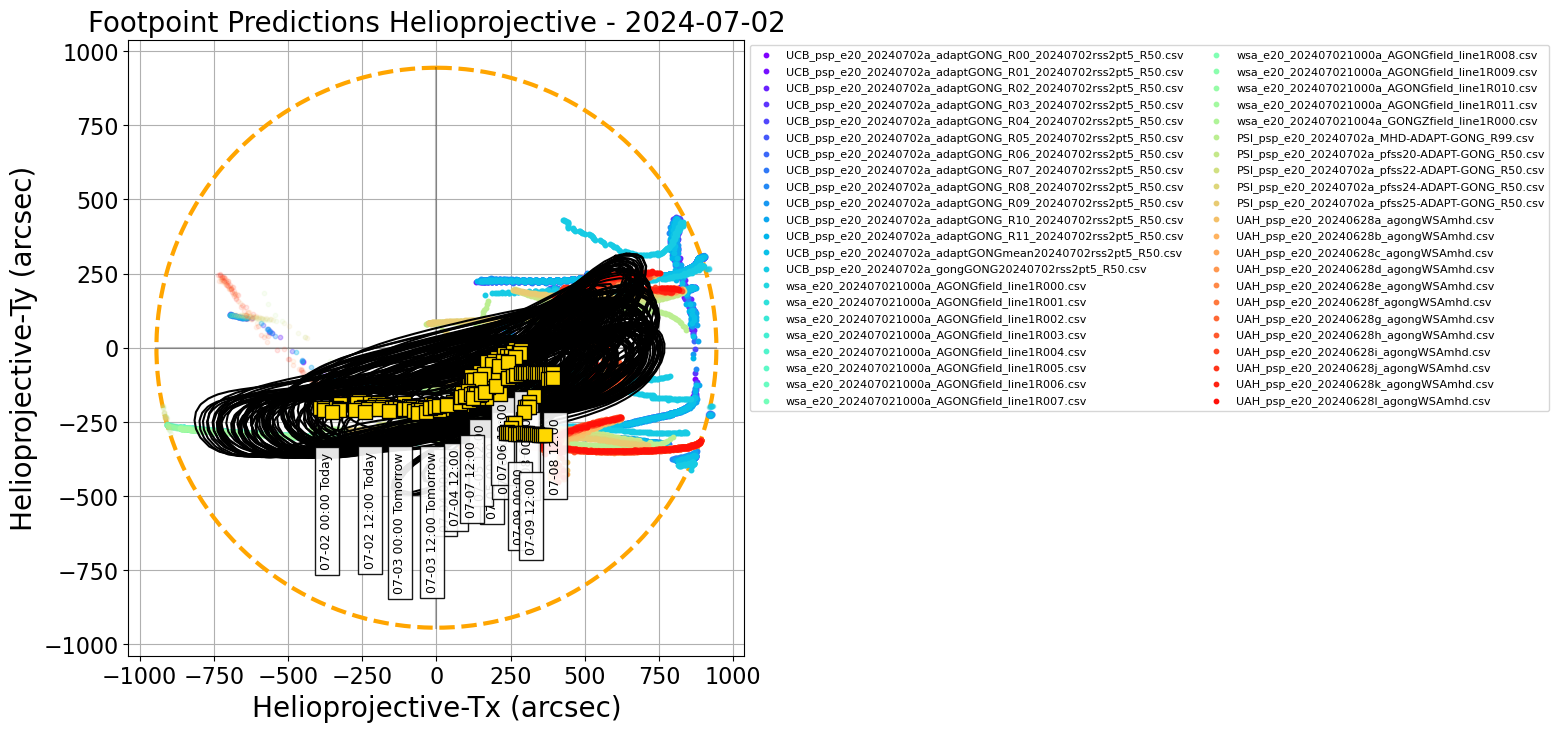
Figure 1.
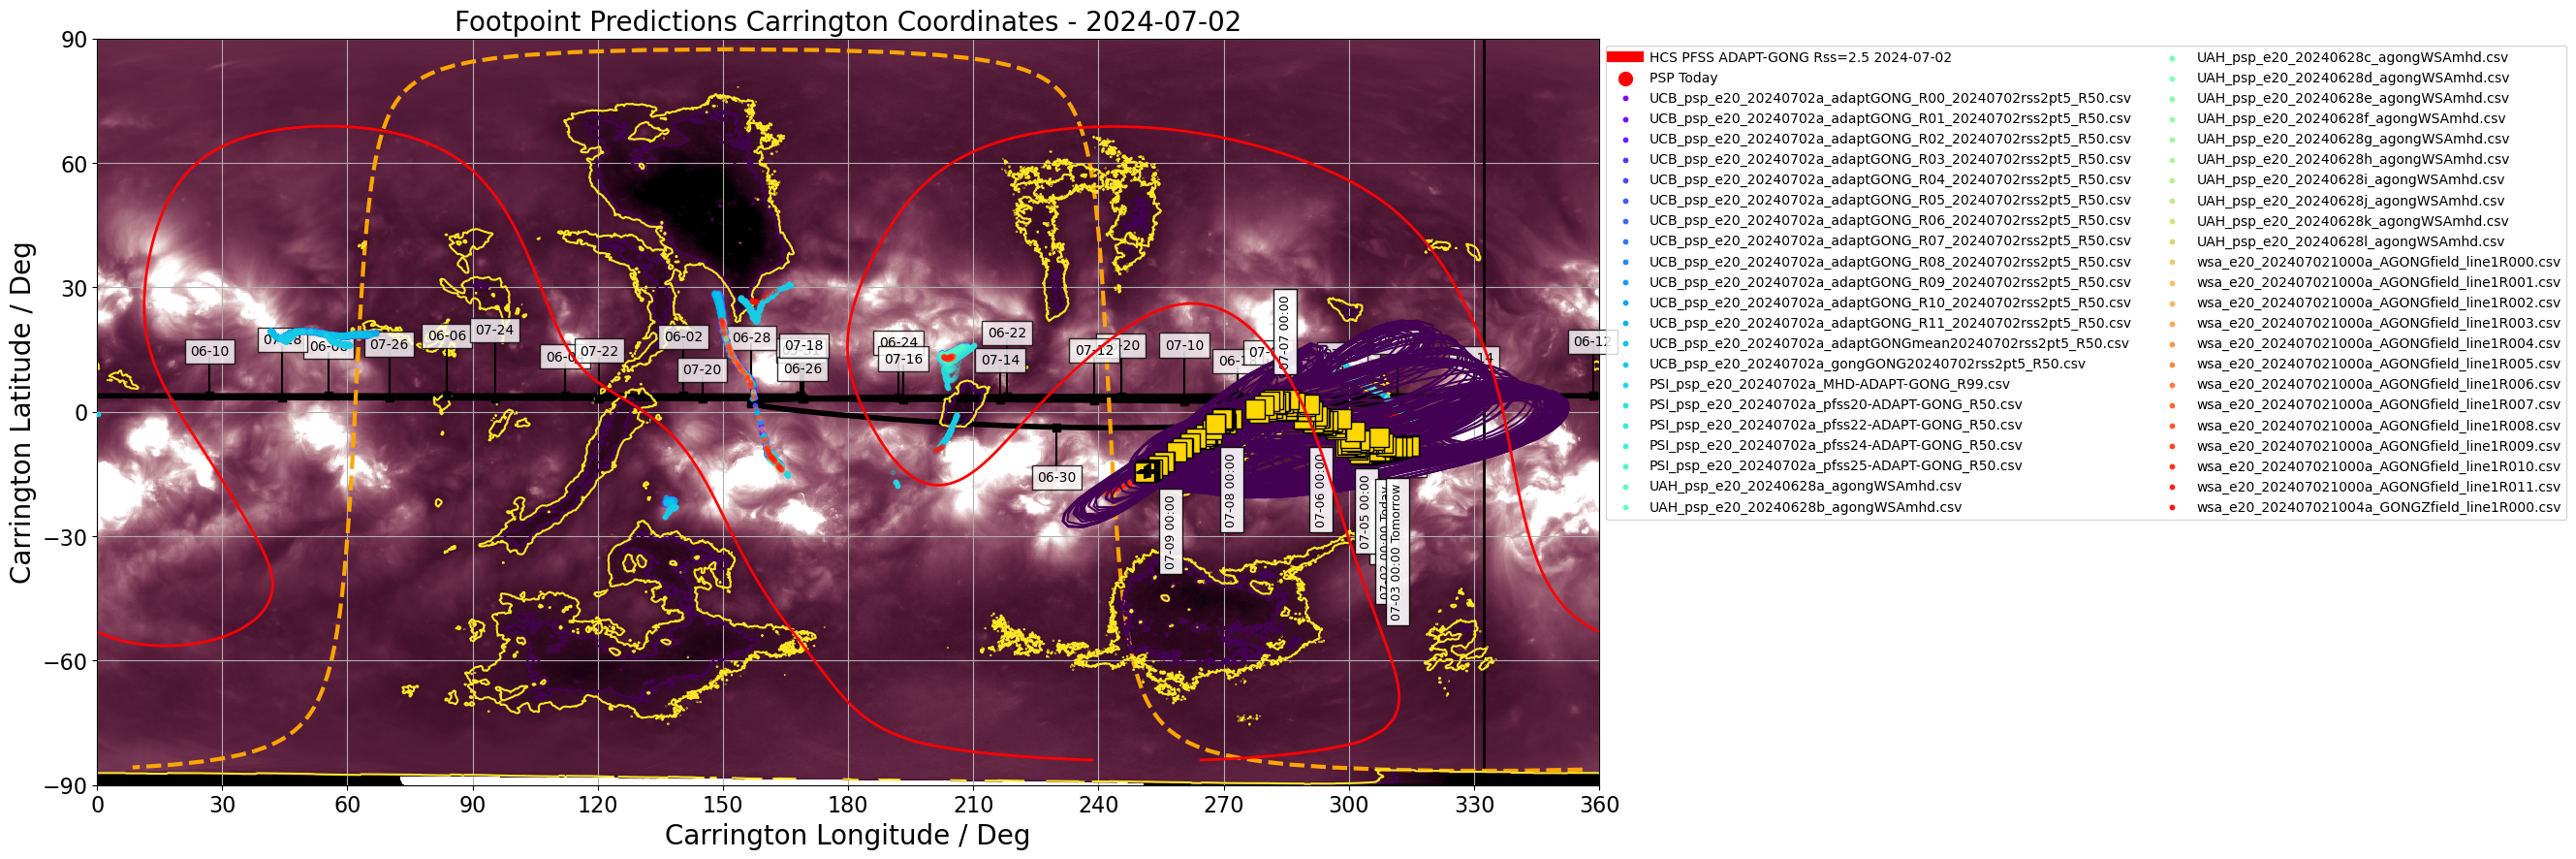
Figure 2.
Figures above show one footpoint per day plotted on the solar disk and in Carrington coordinates (click on figure to zoom and see caption).
The predicted footpoints were kindly provided by the PSP 20th Perihelion modeling team.
Encounter 20 Prediction update 3/3: 2024/07/02
------------------------------------------------
This is the last of three footpoint prediction issued for Parker Solar Probe Encounter 20, which reached perihelion at 11.4Rs on June 30th . The inbound portion of the orbit was on the solar far side but shortly after perihelion the spacecraft emerged over the East limb and has moved rapidly prograde on disk. It is now in its outbound phase. Footpoints are now migrating slowly in Carrington coordinates and remaining near disk center.
Magnetic Connectivity
---------------------
Magnetic connectivity is somewhat bifucated between the active region sources west of disk center identified in yesterday's update (AR13733, AR13729, AR731) and a southern mid-latitude equatorial coronal hole around 250 degrees Carrington longitude. All predictions evenutally migrate to this source by July 6th, but for some models this has already occurred.
Flare Likelihood (CCMC Flare Scoreboard)
----------------------------------------
As of 2024-07-02 at 12:00 UT, the CCMC Flare Scoreboard gave 24-hour average cumulative flare probabilities amounting at 99%, 36% and 4% for GOES C and above, M and above and X-class flares, respectively. A significant number of sunspot complexes currently appear on the visible disk, namely NOAA ARs 13719 - 13735. Active regions at or east of the central meridian are of most relevant to Parker observations.
From the CCMC CME Scoreboard, there is one active Earth-directed CME launched 2024-06-30T03:48 UT with an estimated speed of approx. 309 km/s. It is expected to reach Earth at 2024-07-04T10:00 UT but is not expected to trigger a major geomagnetic event.
*** Please note that the "arrival time" and "emission time" and associated Tx/Ty coordinates for both are reported in the consensus CSV file. The attached plots show the "arrival time" (location of source at time that plasma will arrive at PSP). See https://docs.google.com/presentation/d/1mz02FU24vqKxxLRaJlyScfAh8gB07iOlBsTHApvhls8/edit#slide=id.p for some discussion on these***.
Date and arrival time of plasma parcel at PSP, consensus carrington longitude (deg), latitude (deg), error in longitude, error in latitude, on-disk position of predicted source in X and Y (arcseconds) at arrival time, date and emission time of plasma parcel at the source, on-disk position of predicted source at time parcel is emitted. Each row is the updated source location each hour.
The consensus is generated by forming a distribution of footpoint predictions from all modelers for each hour period, and attempting to fit a Kent distribution. If the fitting fails, the median in longitude and latitude are quoted. If the fitting is successful, the quoted errors are formed by drawing random samples from the fitted distribution and computing the standard deviation in longitude and latitude of those samples. If the fitting fails, the quoted errors are the standard deviation in the longitude and latitude from the raw distribution of predictions. The full shape of the distribution is described by black contours in the associated plots on this website. More details about the procedure can be found at the following preprint of Badman et al. (2023) "Prediction and Verification of Parker Solar Probe Solar Wind Sources at 13.3Rs"
Please note the carrington coordinates (lon,lat) are valid from the quoted timestamp (in UTC) until the next timestamp. The helioprojective coordinates quoted (HP-Tx, HP-Ty) are computed from the carrington coordinate at the quoted timestamp (e.g. midnight UTC each day) and so are valid instantaneously at this time but will corotate with the Sun until the next quoted timestamp. For a discussion of the subtle difference in emission and arrival time and why both are included please see the slide deck.
Individual model prediction tables of coordinates may be found in a Public DropBox. Files in the Public DropBox have three-letter identifiers indicating the associated model (see below).
Three-letter designation for Public DropBox: UCB. Kindly provided by Sam Badman. The model is a simple ballistic propagation from PSP down to the source surface assuming slow wind 360km/s, and then tracing this sub-PSP trajectory through a PFSS model to get footpoints at the photosphere. The source surface height here is 2.5Rs. The PFSS model is generated using various ADAPT maps with GONG and HMI as input, and the model is run using the open source pfsspy package. A more detailed explanation of the model and comparison to PSP E1 results are given here.
Three-letter designation for Public DropBox: PSI. Kindly provided by Pete Riley. For these predictions, PSI is using a combination of modeling approaches, including PFSS solutions, empirically-based polytropic MHD solutions, and a more sophisticated approach that includes the effects of waves and turbulence to heat the corona and the WKB approximation for wave pressures to accelerate the solar wind. Additionally, boundary conditions are derived from both HMI and ADAPT synoptic magnetograms. Together, these allow us to generate a rich set of ensemble realizations from which to make our optimal prediction, as well as pool them with other teams’ forecasts to derive a hyper-ensemble prediction.
Three-letter designation for Public DropBox: wsa. Kindly provided by Shaela Jones. The Wang-Sheeley-Arge (WSA) model is a combined empirical and physics-based model of the corona and solar wind. The coronal portion of the Wang-Sheeley-Arge (WSA) model is comprised of the Potential Field Source Surface (PFSS) and Schatten Current Sheet (SCS) models, where the output of the PFSS model serves as input to the SCS model. The solar wind portion of WSA consists of a simple 1-D kinematic propagation code that takes stream interactions into account in an ad-hoc fashion. It provides predictions of the solar wind speed and interplanetary magnetic field IMF polarity at any specified point in the inner heliosphere. The WSA model can use global maps of the photospheric magnetic flux measurements from a number of sources as its inner boundary condition; here we are using an ensemble of maps from the Air Force Data Assimilative Photospheric Flux Transport (ADAPT) model, based on input GONG magnetograms.
UAH predictions come from the University of Alabama, Huntsville Multiscale Fluid-Kinetic Simulation Suite (MS-FLUKSS, Pogorelov et al. (2014); Pogorelov (2023); Singh et al. (2022)), which can solve the Reynolds-averaged ideal MHD equations for the mixture of thermal and nonthermal solar wind ions coupled with the kinetic Boltzmann equation describing the transport of neutral atoms. An adaptive mesh refinement technique can be employed for efficient high-resolution calculations. The MS-FLUKSS heliospheric MHD model is coupled with the WSA model (Kim et al., 2020), which uses both ADAPT-GONG and ADAPT-HMI input magnetograms, with the PFSS source surface height and the WSA outer boundary at 2.5 and 10 solar radii, respectively. Hence, field line tracing is performed through the MHD domain down to 10 solar radii instantaneously at approximately 1 hour cadence, where the origin of the field line on the photosphere is already known, as described for WSA.
see Prediction and Verification of Parker Solar Probe Solar Wind Sources at 13.3Rs, Badman et al. (2023)
