
The Pysplot package is a new Python library designed for spatio-temporal analysis and visualizations in Heliophysics. It contains tools for handling mission science data in conjunction with spatial ephemeris data, facilitating user-friendly integration of different coordinate frames and units for easy data manipulation and plotting purposes. The Pysplot package also contains functionality for downloading and plotting McIntosh synoptic maps from the publicly available NOAA repository.
The first version of the package has been released and welcomes early beta-testers. Code examples and tutorials can be found in the dedicated Github repository.
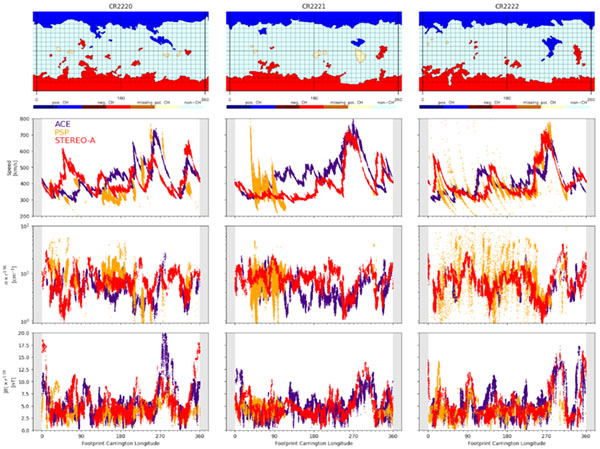
Functionality test example, reproduction of Figure 6 in Allen et al. (2023).
