


Refer to PSP 26th Perihelion Campaign page.
2025-12-11 (CSV, PDF table of coordinates)
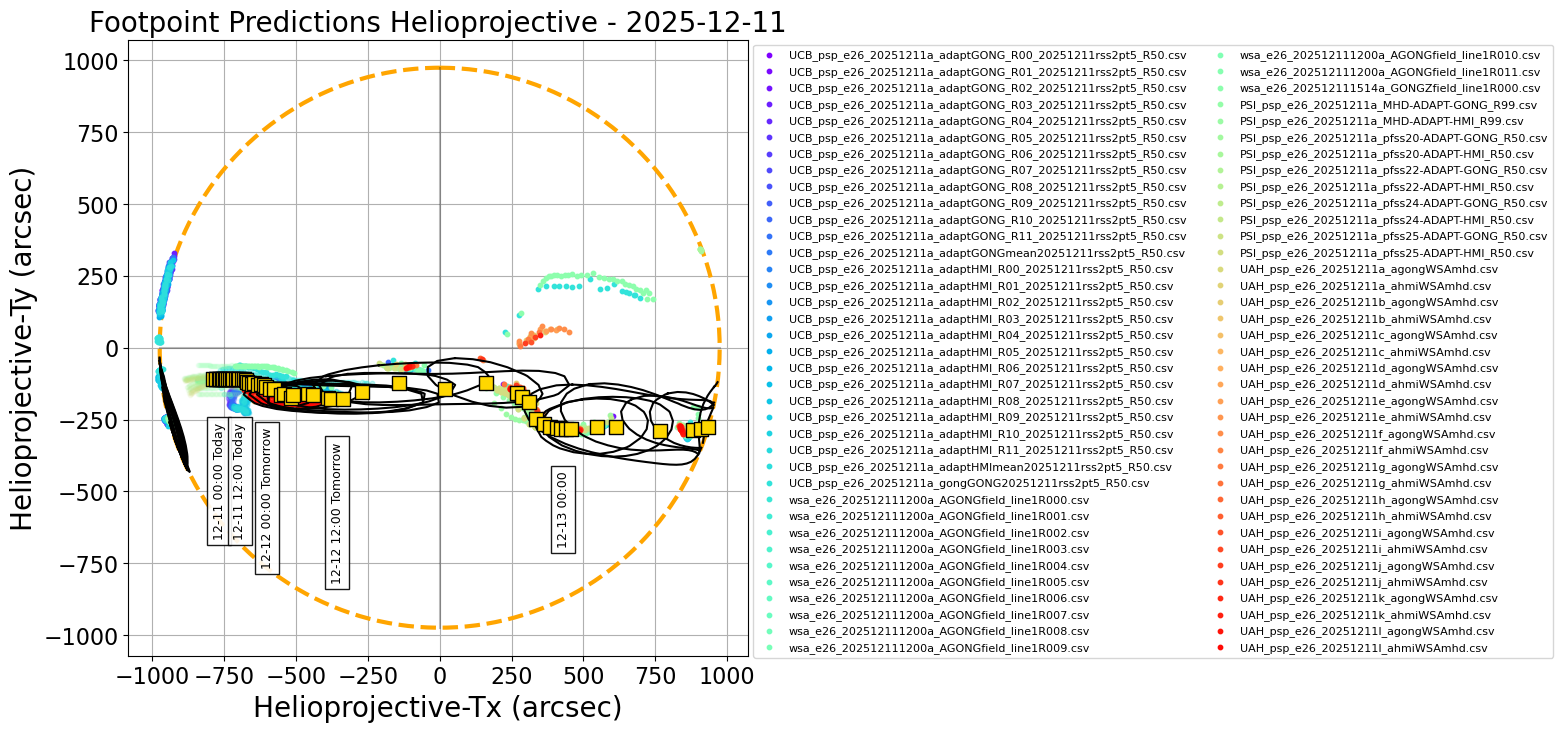
Figure 1.
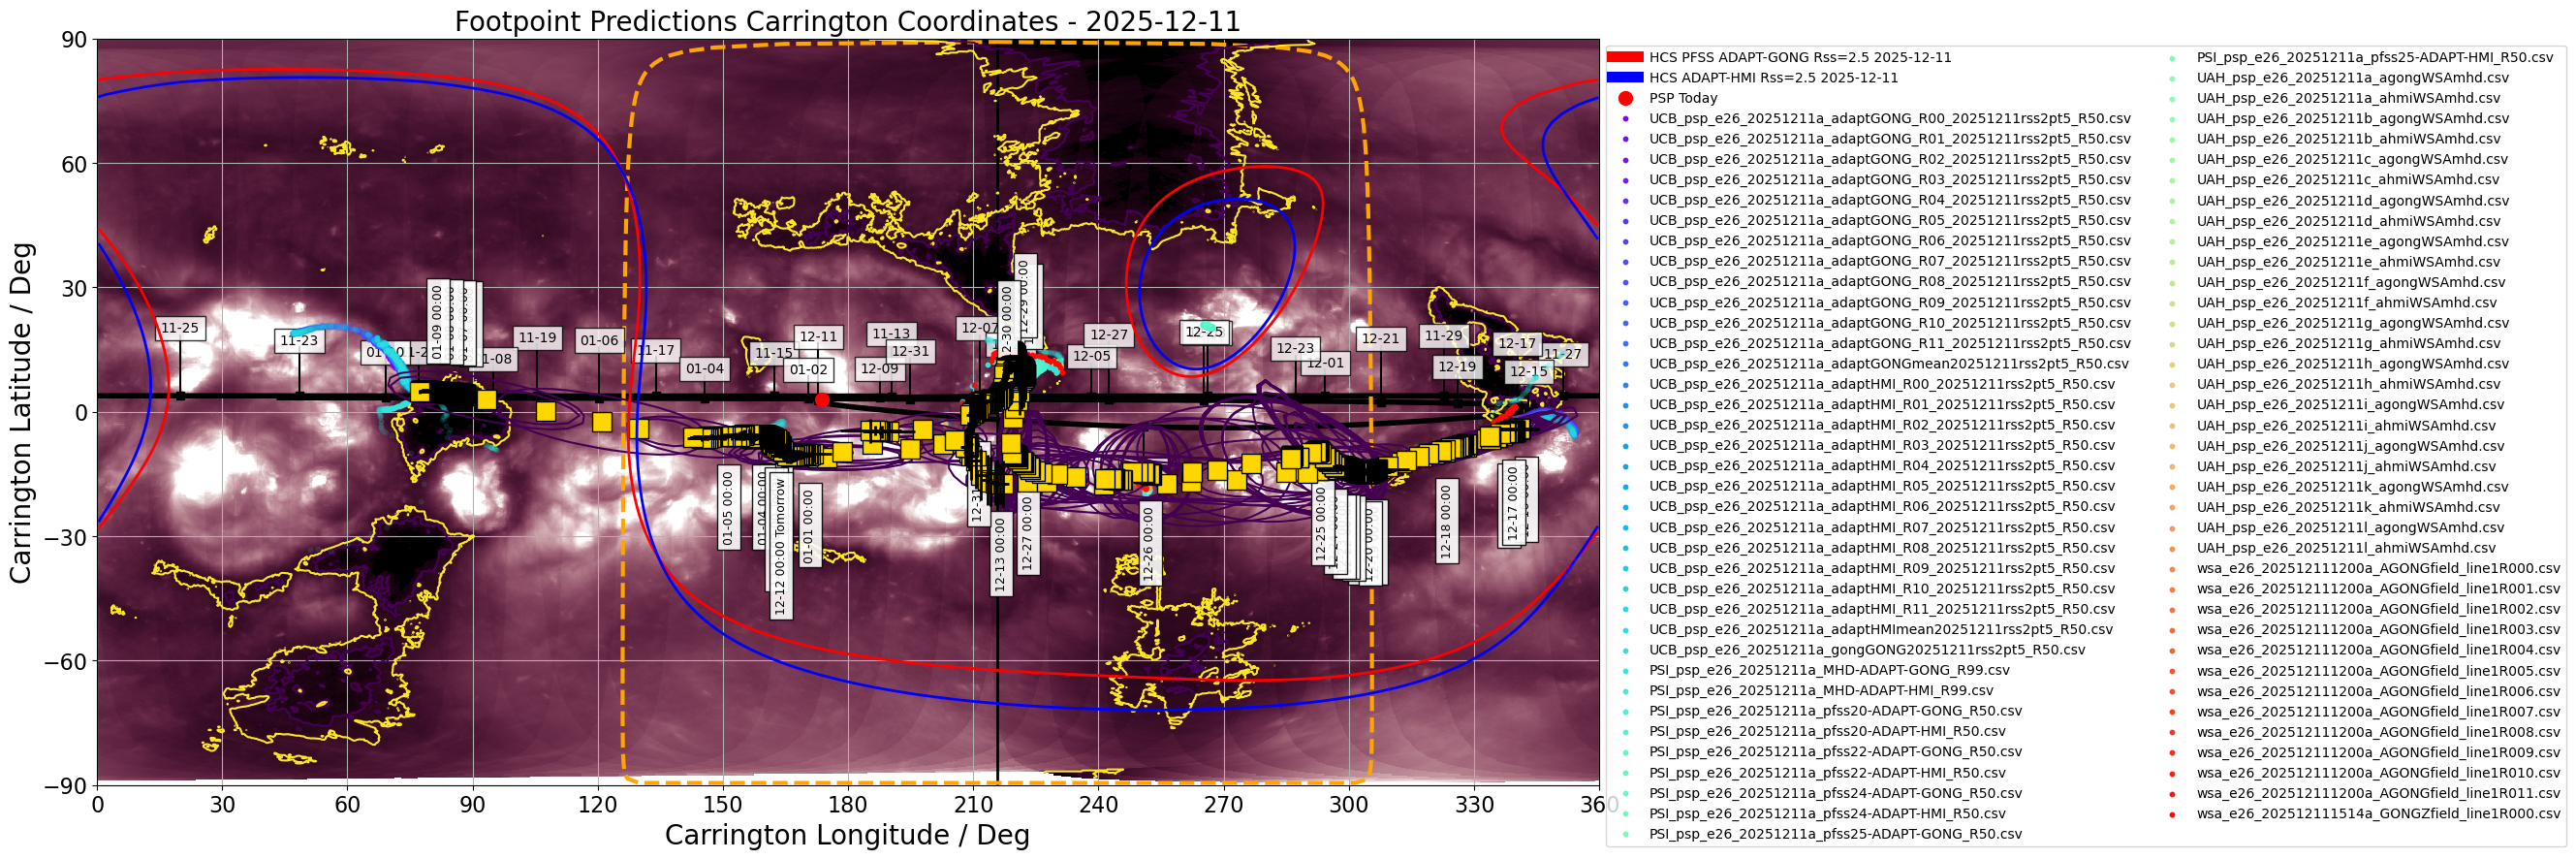
Figure 2.
Figures above show one footpoint per day plotted on the solar disk and in Carrington coordinates (click on figure to zoom and see caption).
The predicted footpoints were kindly provided by the PSP 24rd Perihelion modeling team.
Encounter 26 Prediction update 1/3: 2025/12/11
------------------------------------------------
This is the first of three daily footpoint predictions issued today through Saturday 12/13 for Parker Solar Probe Encounter 26. This is the fifth time Parker will reach its record-setting perihelion of 9.86Rs. Perihelion 26 occurs on Saturday 2025/12/13 at 07:11 UT (03:11 EST). During these three days Parker moves rapidly across the disk reaching the plane of sky above the West limb on perihelion before rapidly receding to the solar far side. We advise observers on on-disk targets the next two days and then advise any off-limb observers to target the West limb plane of sky over the weekend (12/13 to 12/14).
Magnetic Connectivity
---------------------
Parker footpoints cross the disk rapidly over the next few days with source regions changing daily. Beginning today, the footpoints start in a negative polarity coronal hole just east of disk center. Tomorrow (12/12) the footpoints are predicted to cross a pseudostreamer (around 12/12 1400) and jump to another negative polarity coronal hole embedded in active region latitudes in the eastern hemisphere.
After this the footpoints are predicted to remain relatively fixed despite Parker's continued rapid motion, suggesting it will be passing along a bundle of field lines fanning outwards from the edge of this last coronal hole. As it traverses this fan, Parker will be located just 10 solar radii above the solar West limb and underlying the fan is a large number of active regions (see below). We therefore advise observers capable of looking off limb to do so at this time (12/13 - 12/14).
After this, Parker will be located on the solar far side for the remainder of the encounter.
Flare Likelihood (CCMC Flare Scoreboard)
----------------------------------------
As of 2025-12-11 at 12:00 UT, the CCMC Flare Scoreboard gave 24-hour average cumulative flare probabilities amounting to 100%, 30% and 4% for GOES C and above, M and above and X-class flares, respectively. The strongest flare observed over the past 24 hours was a M4.4 at 2025-12-10T21:58 UT, originating from NOAA AR 14294. Several more M-class flares have been observed. Sunspot complexes present on the solar disk include NOAA ARs 14294, 14295, 14298 - 14300 and 14303 - 14305. All of them but ARs 14303 and 14305 are at geoeffective longitudes in the western solar hemisphere, where Parker will cross prior to perihelion. A network of interconnected coronal holes exists in the northern hemisphere, mostly in the northeastern quadrant with a smaller part extending into low western longitudes.
From the CCMC CME Scoreboard, an Earth-directed CME from an apparent location S12W53 was associated with an X1.1 flare in NOAA AR 14298 and started on 2025-12-08T05:12 UT. This CME’s near-Sun speed was 664 km/s and its arrival was recorded less than 24 h ago, around 2025-12-10T20:00, giving rise to a moderate storm with Kp peaking at 6.33 and a Dst of -75 nT. The magnetosphere appears to be at the start of its recovery phase. Any West-limb directed CMEs at the weekend are prime targets for Sun-Parker connection studies.
------------------
*** Please note that the "arrival time" and "emission time" and associated Tx/Ty coordinates for both are reported in the consensus CSV file. The attached plots show the "arrival time" (location of source at time that plasma will arrive at PSP). See https://docs.google.com/presentation/d/1mz02FU24vqKxxLRaJlyScfAh8gB07iOlBsTHApvhls8/edit#slide=id.p for some discussion on these***.
2025-12-12 (CSV, PDF table of coordinates)
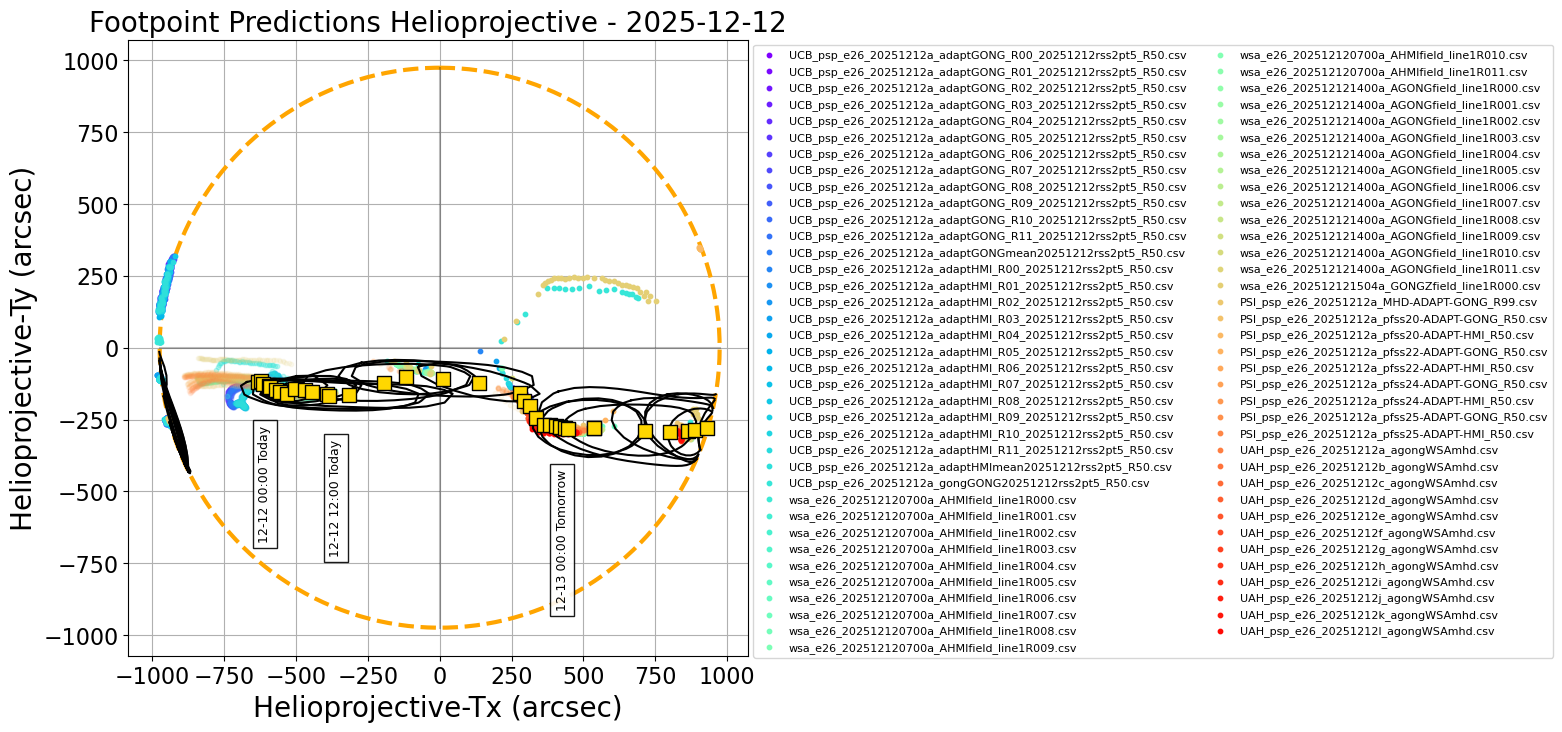
Figure 1.
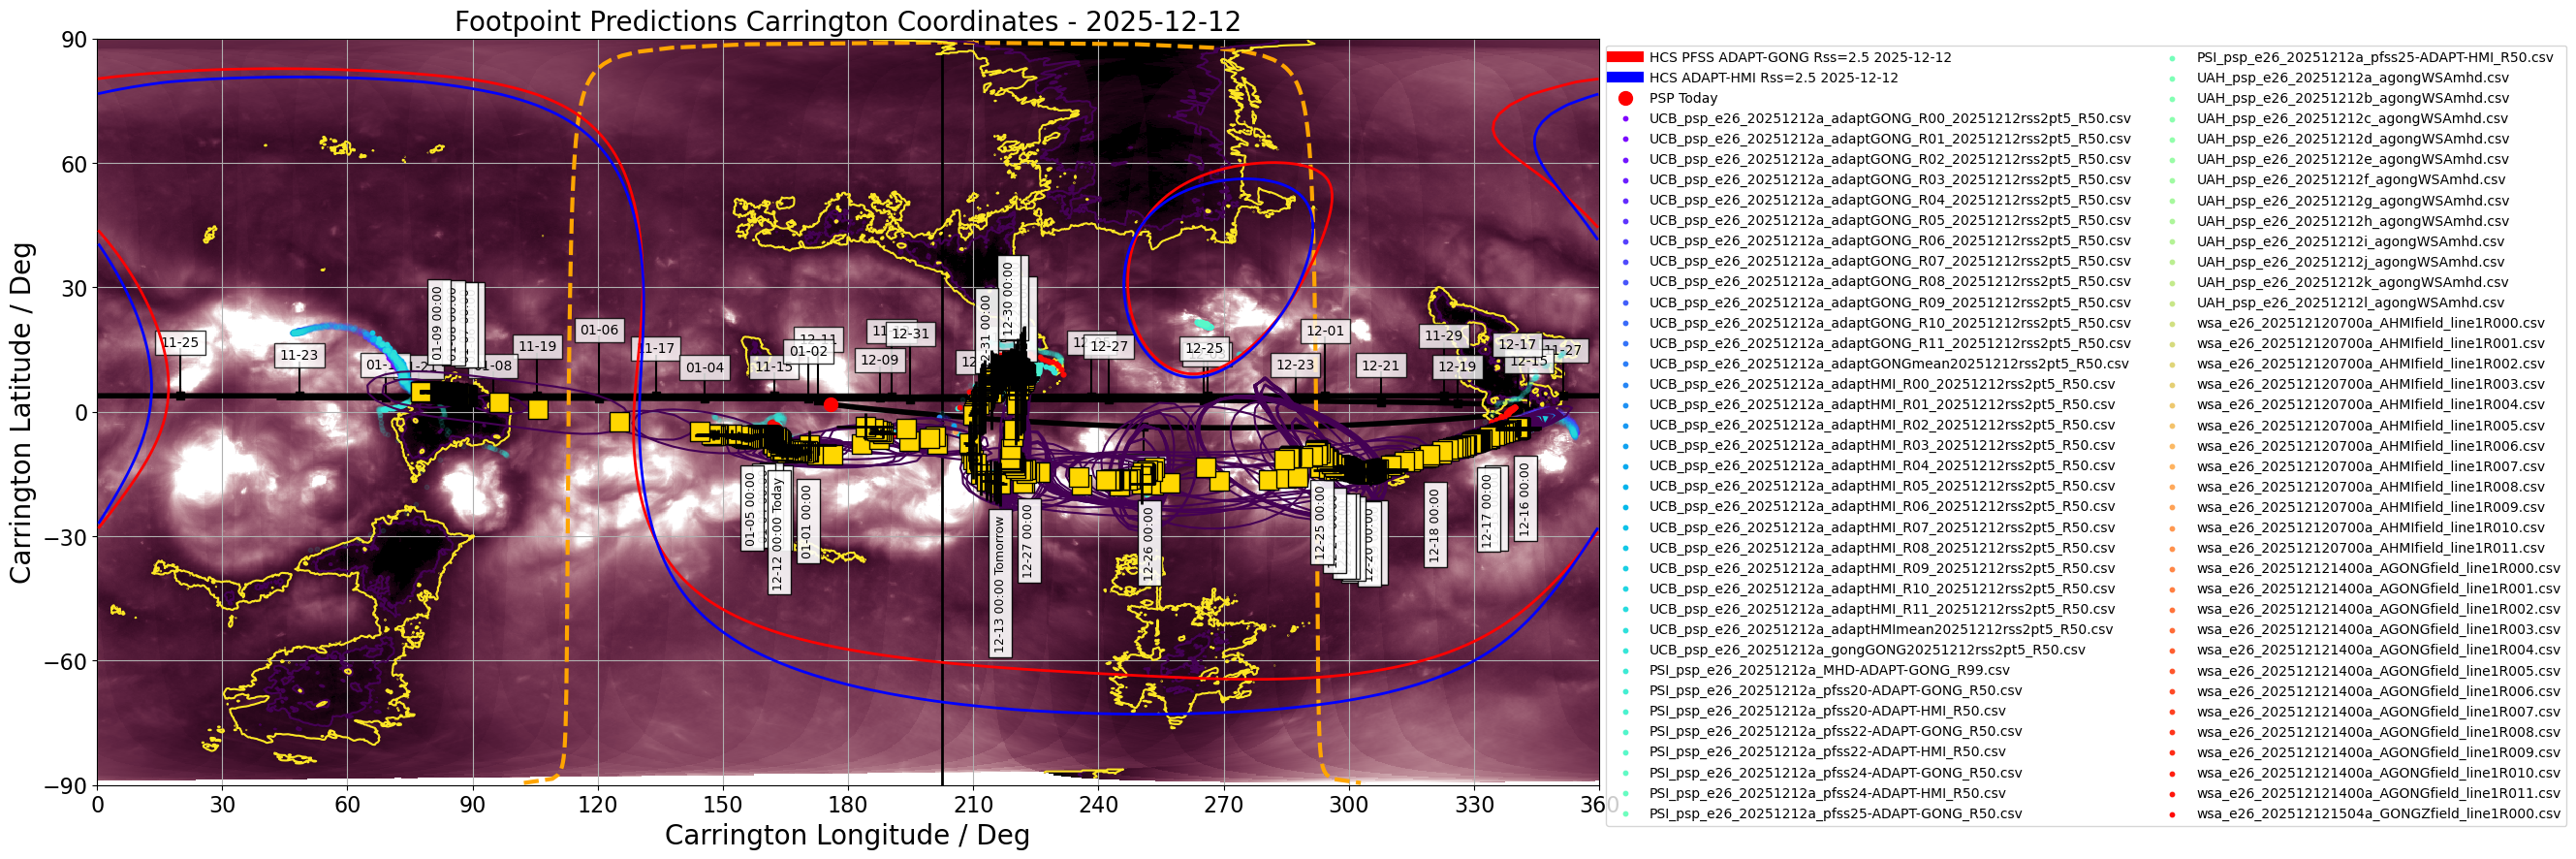
Figure 2.
Figures above show one footpoint per day plotted on the solar disk and in Carrington coordinates (click on figure to zoom and see caption).
The predicted footpoints were kindly provided by the PSP 24rd Perihelion modeling team.
Encounter 26 Prediction update 2/3: 2025/12/12
------------------------------------------------
This is the second of three daily footpoint predictions issued yesterday through Saturday 12/13 for Parker Solar Probe Encounter 26. This is the fifth time Parker will reach its record-breaking perihelion of 9.86Rs. Perihelion 26 occurs on Saturday 2025/12/13 at 07:11 UT (03:11 EST). During these three days Parker moves rapidly across the disk reaching the plane of sky above the West limb on perihelion before rapidly receding to the solar far side. We advise observers on on-disk targets the next two days and then advise any off-limb observers to target the West limb plane of sky over the weekend (12/13 to 12/14).
Magnetic Connectivity
---------------------
Parker footpoints are crossing the disk rapidly up to perihelion with source regions changing daily. The footpoints today (12/12) are predicted to cross a pseudostreamer and jump to another negative polarity coronal hole embedded in active region latitudes in the eastern hemisphere.
After this the footpoints are predicted to remain relatively fixed despite Parker's continued rapid motion, suggesting it will be passing along a bundle of field lines fanning outwards from the edge of this last coronal hole. As it traverses this fan, Parker will be located just 10 solar radii above the solar West limb and underlying the fan is a large number of active regions (see below). We therefore advise observers capable of looking off limb to do so at this time (12/13 - 12/14).
After this, Parker will be located on the solar far side for the remainder of the encounter.
Flare Likelihood (CCMC Flare Scoreboard)
----------------------------------------
As of 2025-12-12 at 12:00 UT, the CCMC Flare Scoreboard gave 24-hour average cumulative flare probabilities amounting to 94%, 18% and 4% for GOES C and above, M and above and X-class flares, respectively, similarly to yesterday’s update. The strongest flare observed over the past 24 hours was an M2.0 at 2025-12-12T04:50, originating from NOAA AR 14303. Sunspot complexes present on the solar disk include NOAA ARs 14294 - 14296, 14299 and 14303 - 14307. ARs 14303, 14305 and 14307 are on the central meridian, with AR 14303 at low western longitudes. All other sunspot complexes are at geoeffective western longitudes, where Parker will cross prior to perihelion. The network of interconnected coronal holes reported yesterday has rorated with its westermost part approaching geoeffective longitudes.
From the CCMC CME Scoreboard, there is no active Earth-directed CME at this time. The magnetosphere is into the recovery phase from a moderate geomagnetic storm due to the CME reported yesterday. Any West-limb directed CMEs at the weekend are prime targets for Sun-Parker connection studies.
------------------
*** Please note that the "arrival time" and "emission time" and associated Tx/Ty coordinates for both are reported in the consensus CSV file. The attached plots show the "arrival time" (location of source at time that plasma will arrive at PSP). See https://docs.google.com/presentation/d/1mz02FU24vqKxxLRaJlyScfAh8gB07iOlBsTHApvhls8/edit#slide=id.p for some discussion on these***.
2025-12-13 (CSV, PDF table of coordinates)
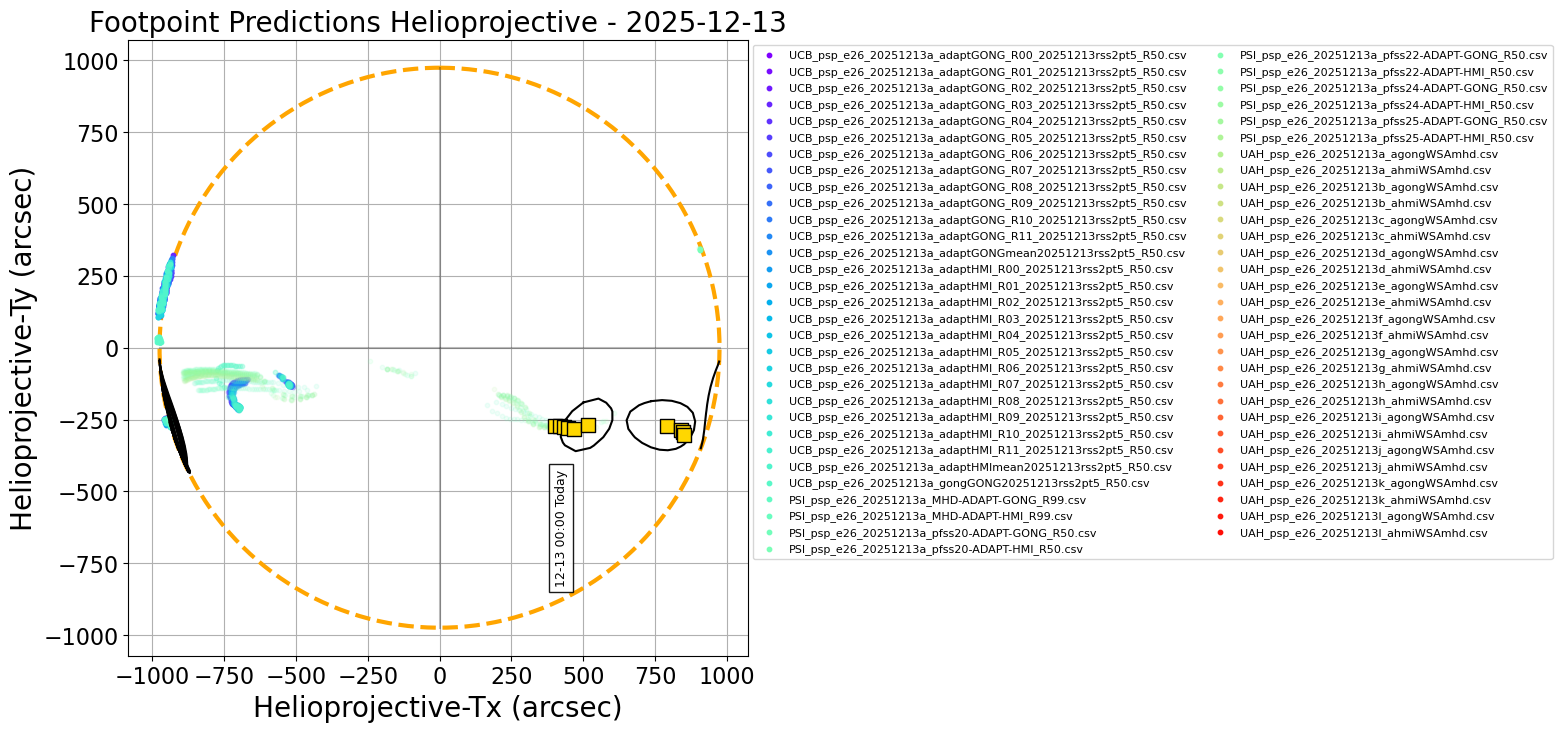
Figure 1.
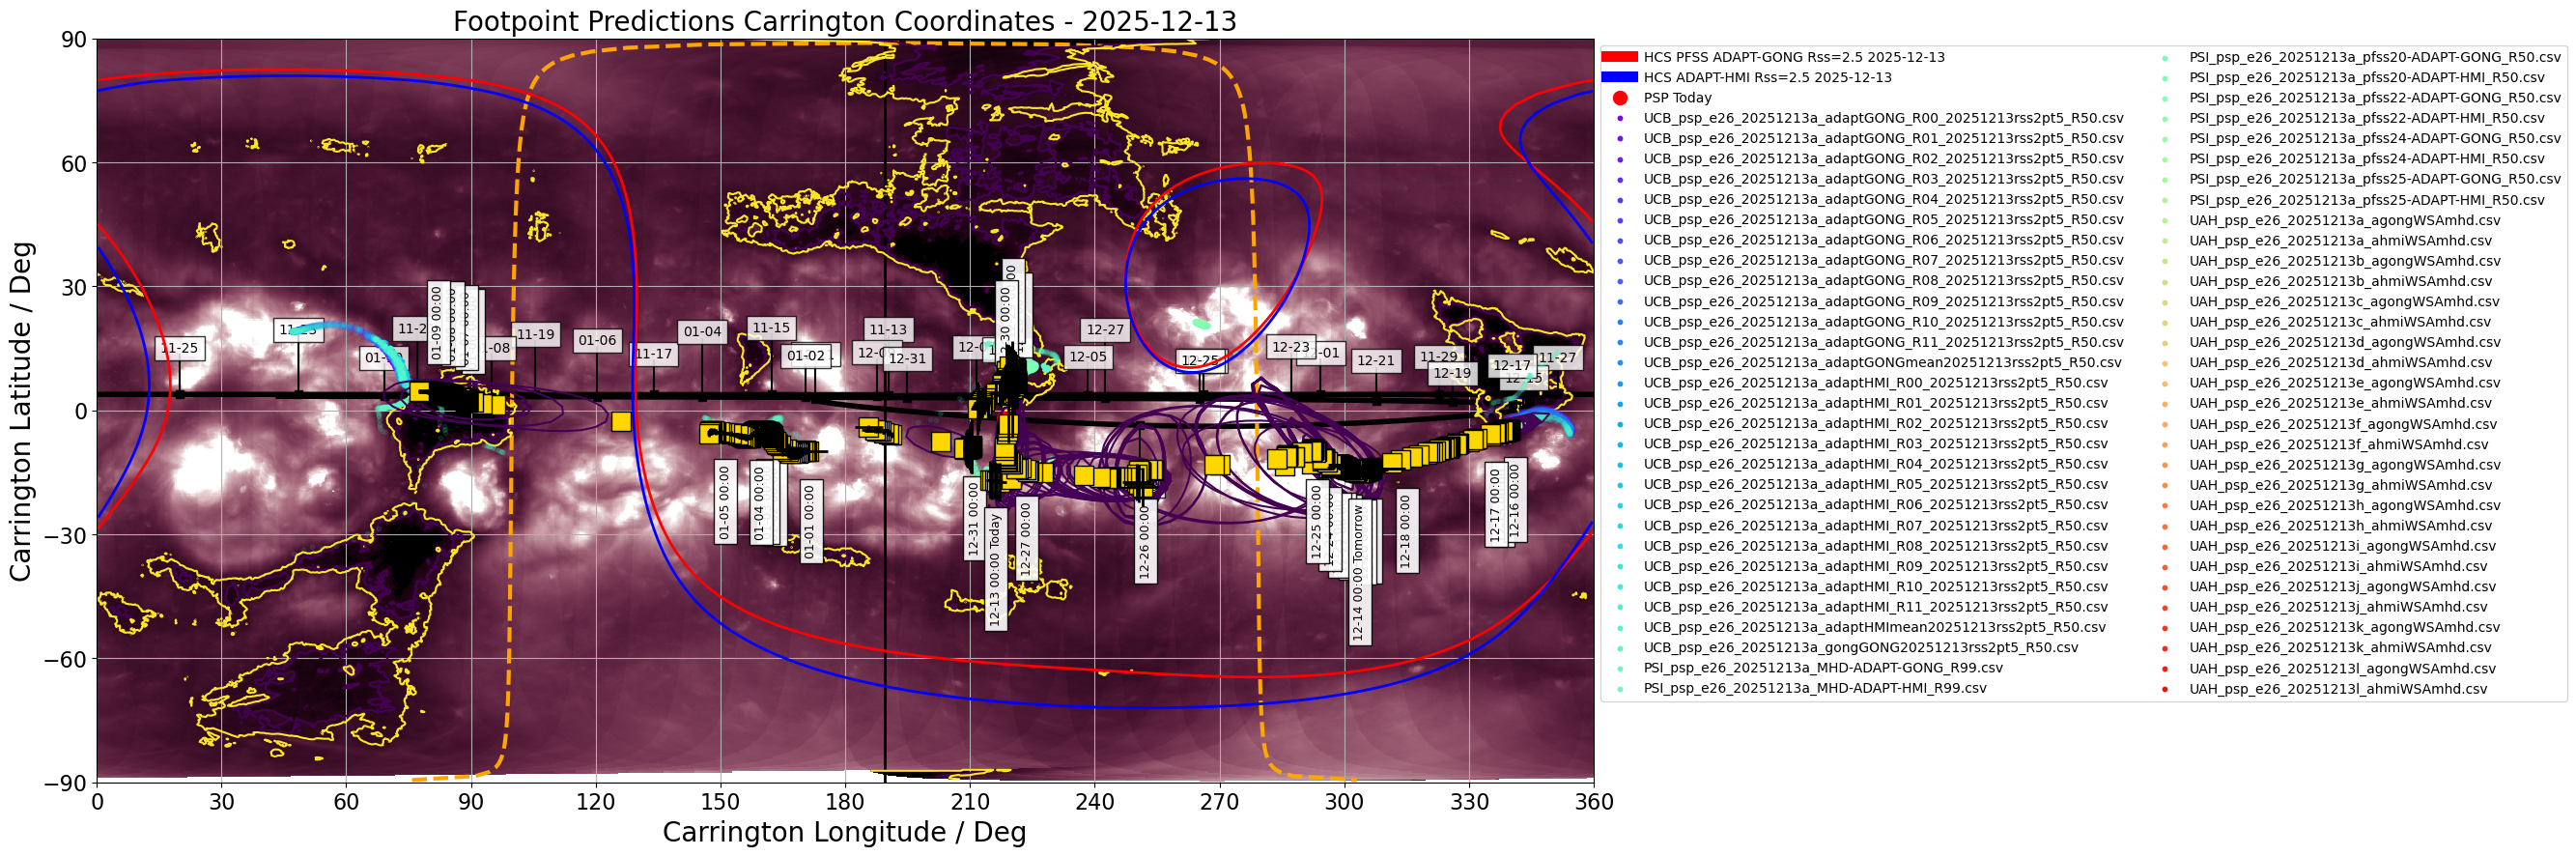
Figure 2.
Figures above show one footpoint per day plotted on the solar disk and in Carrington coordinates (click on figure to zoom and see caption).
The predicted footpoints were kindly provided by the PSP 24rd Perihelion modeling team.
Encounter 26 Prediction update 3/3: 2025/12/13
------------------------------------------------
This is the final of three daily footpoint predictions issued for Parker Solar Probe Encounter 26. This is the fifth time Parker will reach its record-setting perihelion of 9.86Rs. Perihelion 26 occurred on Saturday 2025/12/13 at 07:11 UT (03:11 EST). Today, Parker's footpoints are concentrated in the solar western hemisphere, while the spacecraft is located in the plane of sky above the West limb before rapidly receding to the solar far side. We advise observers to target the West limb, and especially the plane of sky above it over this weekend (12/13 to 12/14).
Magnetic Connectivity
---------------------
Paker's footpoints are predicted to remain relatively fixed today despite Parker's continued rapid motion, suggesting it will be passing along a bundle of field lines fanning outwards from the edge of a coronal hole in the solar western hemisphere. As it traverses this fan, Parker will be located just 10 solar radii above the solar West limb and underlying the fan is a large number of active regions (see below). We therefore advise observers capable of looking off limb to do so at this time (12/13 - 12/14).
After this, Parker will be located on the solar far side for the remainder of the encounter.
Flare Likelihood (CCMC Flare Scoreboard)
----------------------------------------
As of 2025-12-13 at 12:00 UT, the CCMC Flare Scoreboard gave 24-hour average cumulative flare probabilities amounting to 77%, 10% and 1% for GOES C and above, M and above and X-class flares, respectively, slightly lower compared to yesterday’s update. The strongest flare observed over the past 24 hours was a C8.7 at 2025-12-13T10:36 UT, originating from NOAA AR 14294 at the western solar limb. Sunspot complexes present on the solar disk include NOAA ARs 14294, 14296, 14299, 14300 and 14303 - 14308. All of them but AR 14308 are at western longitudes, with most of them on or close to the western limb, where Parker sampled through its perihelion earlier today. The network of interconnected coronal holes reported already occupies low eastern longitudes at its easternmost part with its western part at geoeffective longitudes in the northwestern quadrant.
From the CCMC CME Scoreboard, there is no active Earth-directed CME at this time. The magnetosphere is slowly recovering from a moderate geomagnetic storm due to the CME reported in the first update. Any West-limb directed CMEs at the weekend are prime targets for Sun-Parker connection studies.
------------------
*** Please note that the "arrival time" and "emission time" and associated Tx/Ty coordinates for both are reported in the consensus CSV file. The attached plots show the "arrival time" (location of source at time that plasma will arrive at PSP). See https://docs.google.com/presentation/d/1mz02FU24vqKxxLRaJlyScfAh8gB07iOlBsTHApvhls8/edit#slide=id.p for some discussion on these***.
Date and arrival time of plasma parcel at PSP, consensus carrington longitude (deg), latitude (deg), error in longitude, error in latitude, on-disk position of predicted source in X and Y (arcseconds) at arrival time, date and emission time of plasma parcel at the source, on-disk position of predicted source at time parcel is emitted. Each row is the updated source location each hour.
The consensus is generated by forming a distribution of footpoint predictions from all modelers for each hour period, and attempting to fit a Kent distribution. If the fitting fails, the median in longitude and latitude are quoted. If the fitting is successful, the quoted errors are formed by drawing random samples from the fitted distribution and computing the standard deviation in longitude and latitude of those samples. If the fitting fails, the quoted errors are the standard deviation in the longitude and latitude from the raw distribution of predictions. The full shape of the distribution is described by black contours in the associated plots on this website. More details about the procedure can be found at the following preprint of Badman et al. (2023) "Prediction and Verification of Parker Solar Probe Solar Wind Sources at 13.3Rs"
Please note the carrington coordinates (lon,lat) are valid from the quoted timestamp (in UTC) until the next timestamp. The helioprojective coordinates quoted (HP-Tx, HP-Ty) are computed from the carrington coordinate at the quoted timestamp (e.g. midnight UTC each day) and so are valid instantaneously at this time but will corotate with the Sun until the next quoted timestamp. For a discussion of the subtle difference in emission and arrival time and why both are included please see the slide deck.
Individual model prediction tables of coordinates may be found in a Public DropBox. Files in the Public DropBox have three-letter identifiers indicating the associated model (see below).
Three-letter designation for Public DropBox: UCB. Kindly provided by Sam Badman. The model is a simple ballistic propagation from PSP down to the source surface assuming slow wind 360km/s, and then tracing this sub-PSP trajectory through a PFSS model to get footpoints at the photosphere. The source surface height here is 2.5Rs. The PFSS model is generated using various ADAPT maps with GONG and HMI as input, and the model is run using the open source pfsspy package. A more detailed explanation of the model and comparison to PSP E1 results are given here.
Three-letter designation for Public DropBox: PSI. Kindly provided by Pete Riley. For these predictions, PSI is using a combination of modeling approaches, including PFSS solutions, empirically-based polytropic MHD solutions, and a more sophisticated approach that includes the effects of waves and turbulence to heat the corona and the WKB approximation for wave pressures to accelerate the solar wind. Additionally, boundary conditions are derived from both HMI and ADAPT synoptic magnetograms. Together, these allow us to generate a rich set of ensemble realizations from which to make our optimal prediction, as well as pool them with other teams’ forecasts to derive a hyper-ensemble prediction.
Three-letter designation for Public DropBox: wsa. Kindly provided by Shaela Jones. The Wang-Sheeley-Arge (WSA) model is a combined empirical and physics-based model of the corona and solar wind. The coronal portion of the Wang-Sheeley-Arge (WSA) model is comprised of the Potential Field Source Surface (PFSS) and Schatten Current Sheet (SCS) models, where the output of the PFSS model serves as input to the SCS model. The solar wind portion of WSA consists of a simple 1-D kinematic propagation code that takes stream interactions into account in an ad-hoc fashion. It provides predictions of the solar wind speed and interplanetary magnetic field IMF polarity at any specified point in the inner heliosphere. The WSA model can use global maps of the photospheric magnetic flux measurements from a number of sources as its inner boundary condition; here we are using an ensemble of maps from the Air Force Data Assimilative Photospheric Flux Transport (ADAPT) model, based on input GONG magnetograms.
UAH predictions come from the University of Alabama, Huntsville Multiscale Fluid-Kinetic Simulation Suite (MS-FLUKSS, Pogorelov et al. (2014); Pogorelov (2023); Singh et al. (2022)), which can solve the Reynolds-averaged ideal MHD equations for the mixture of thermal and nonthermal solar wind ions coupled with the kinetic Boltzmann equation describing the transport of neutral atoms. An adaptive mesh refinement technique can be employed for efficient high-resolution calculations. The MS-FLUKSS heliospheric MHD model is coupled with the WSA model (Kim et al., 2020), which uses both ADAPT-GONG and ADAPT-HMI input magnetograms, with the PFSS source surface height and the WSA outer boundary at 2.5 and 10 solar radii, respectively. Hence, field line tracing is performed through the MHD domain down to 10 solar radii instantaneously at approximately 1 hour cadence, where the origin of the field line on the photosphere is already known, as described for WSA.
see Prediction and Verification of Parker Solar Probe Solar Wind Sources at 13.3Rs, Badman et al. (2023)
