


Refer to PSP 15th Perihelion Campaign page.
2023-03-13 (CSV, PDF table of coordinates)
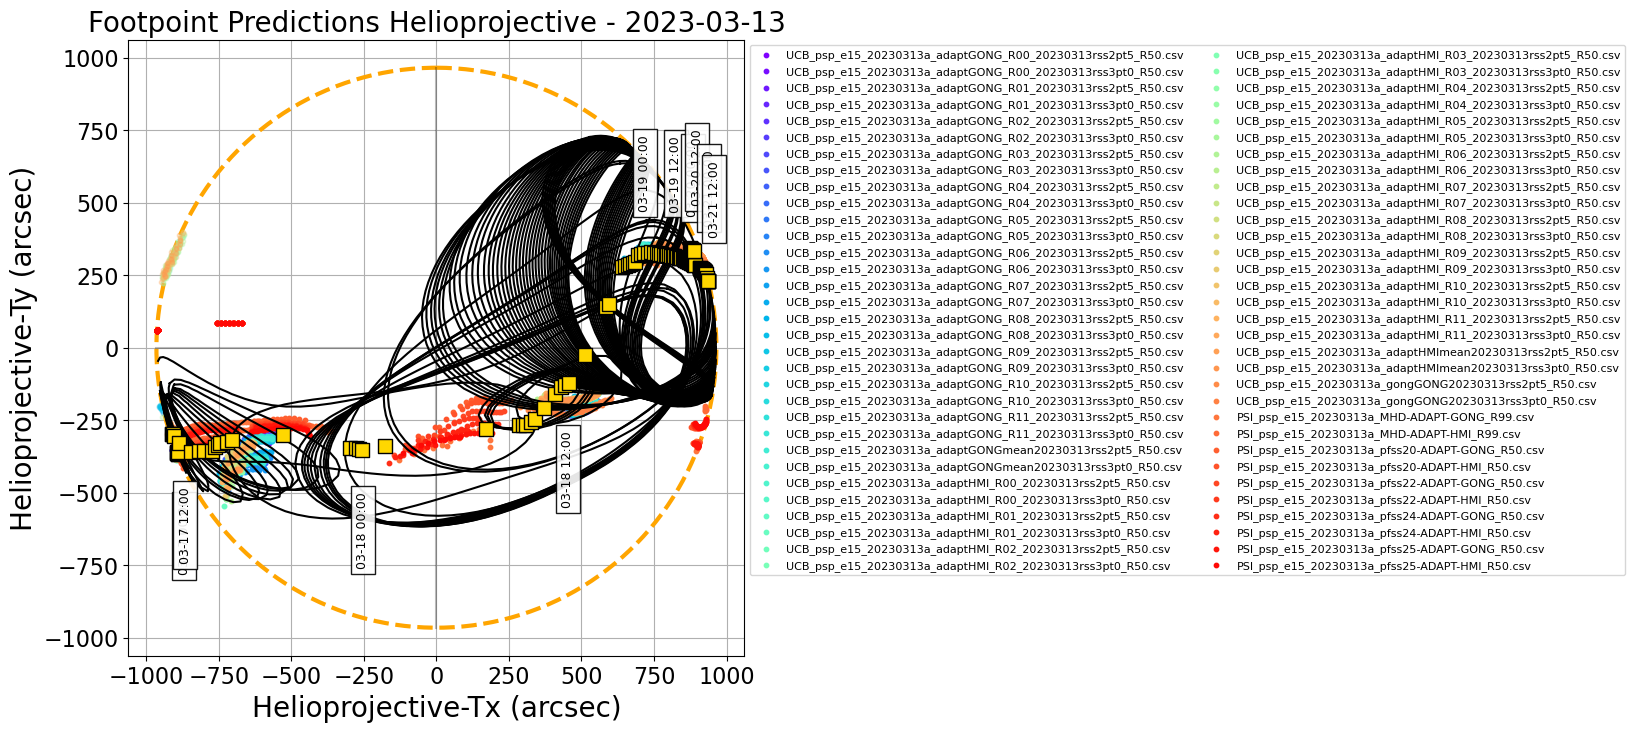
Figure 1.
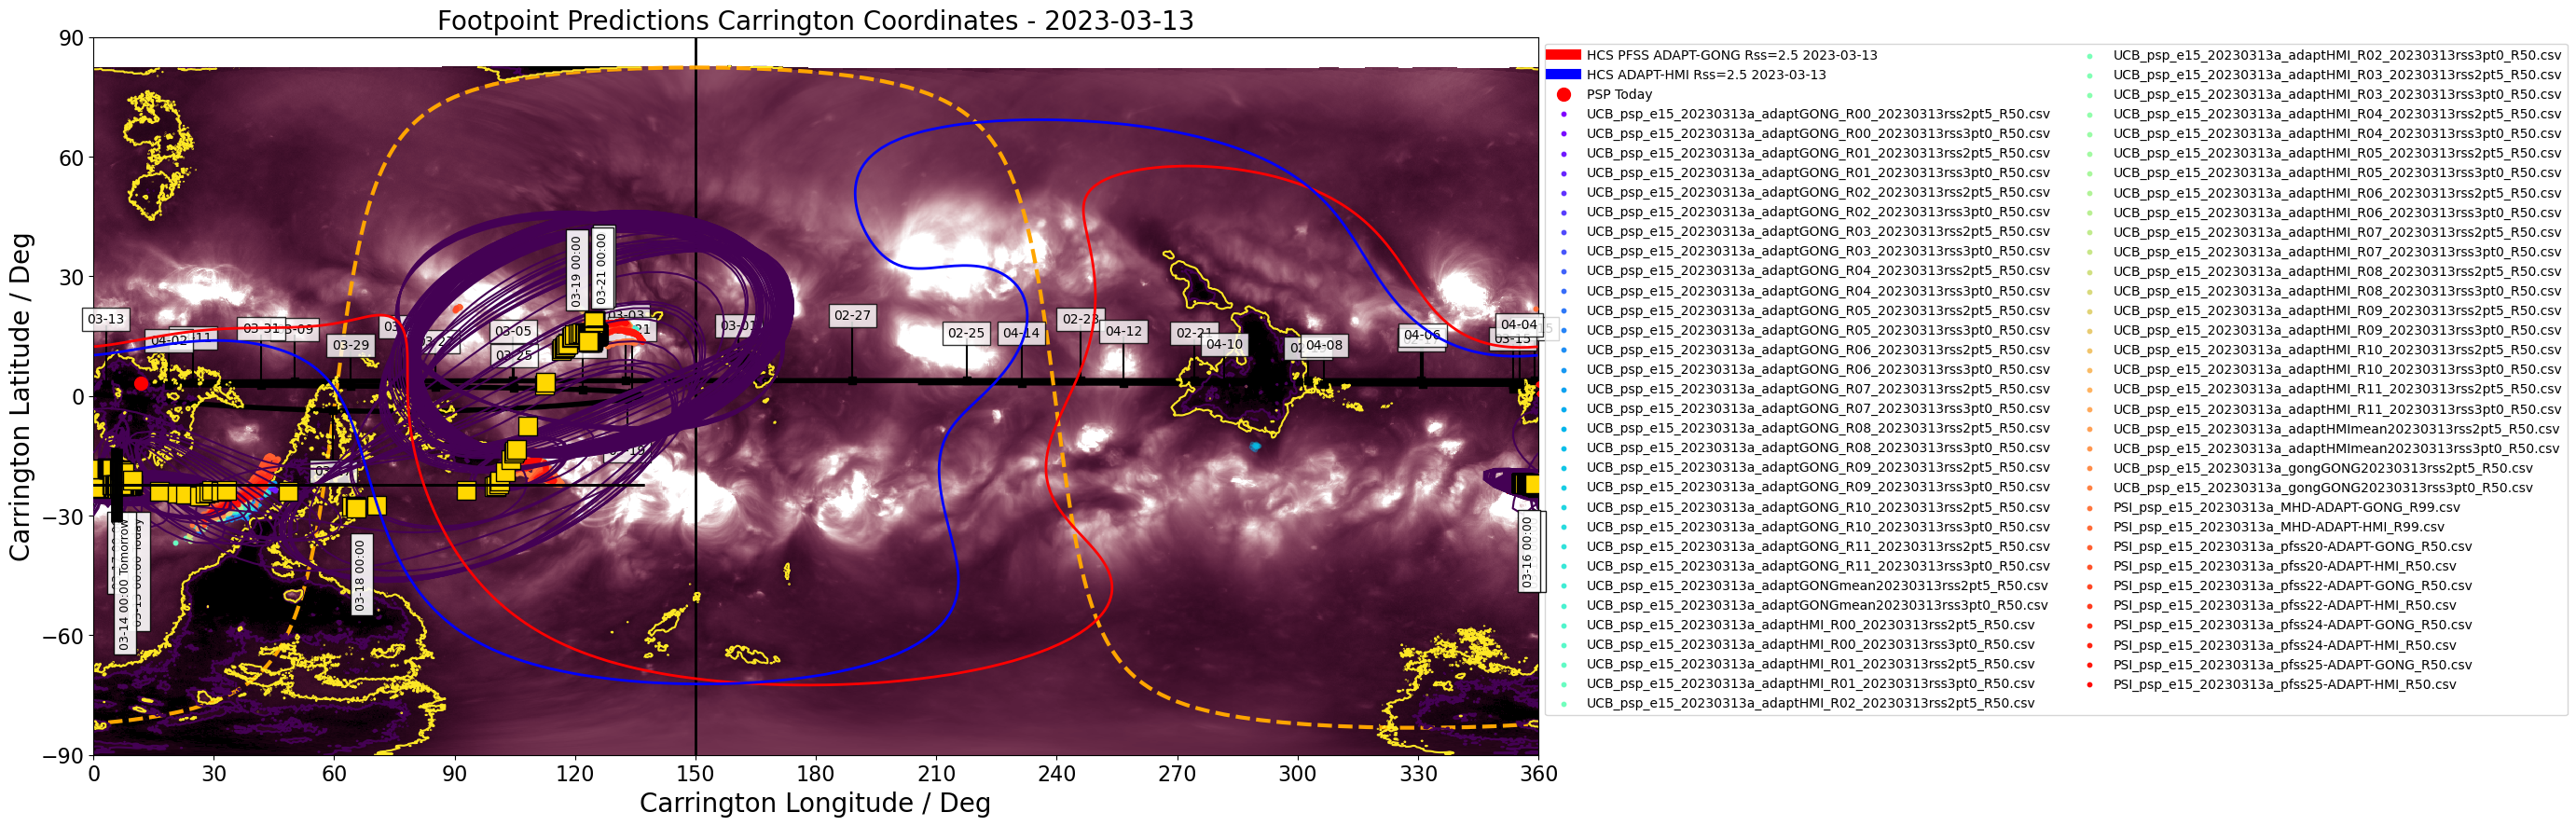
Figure 2.
Figures above show one footpoint per day plotted on the solar disk and in Carrington coordinates (click on figure to zoom and see caption).
The predicted footpoints were kindly provided by the PSP 15th Perihelion modeling team.
Encounter 15 Prediction update #1 2023/03/13 (next one on 3/16)
This is a first preliminary prediction for PSP's footpoints ahead of the fully on-disk 15th solar encounter (Perihelion 03/17). Daily predictions will commence on Thursday 2023/03/16 and run through Tuesday 2023/03/21.
Today PSP is entering its encounter phase and rapidly approaching the Sun, traveling in the Earth-ward direction from behind the East limb.
We expect footpoints to emerge on the East limb in the southern polar region around 2300UT on 2023/3/16 and proceed to move rapidly across disk from source to source, reaching the West limb around 2023/3/21 0400UT.
The predictions suggest an initial negative polarity connection to what remains of the southern polar coronal hole as it rotates over the East limb. PSP then quickly speeds ahead of the Sun, crossing the HCS and connecting to a coronal or active region complex in the southern mid-latitudes by 0000UT 3/18, towards the end of the on disk phase, the source switches to a similar (but still positive polarity) source in the northern mid-latitudes in the active region belt (03/19 through 03/21). These latter two locations roughly lie within complexes 13251 (southern) and 13252 (northern) as seen near disk center today : https://www.solarmonitor.org/full_disk.php?date=20230313&type=saia_00193&indexnum=1 .
The southern polar coronal hole feature is currently behind the limb, but should become visible prior to the next prediction being issued (3/16).
We hope to include a MAG4 flare forecast statement in the next update too.
*** Please note that the "arrival time" and "emission time" and associated Tx/Ty coordinates for both reported in the consensus CSV file. The attached plots show the "arrival time" (location of source at time that plasma will arrive at PSP). See https://docs.google.com/presentation/d/1mz02FU24vqKxxLRaJlyScfAh8gB07iOlBsTHApvhls8/edit#slide=id.p for some discussion on these ***.
2023-03-16 (CSV, PDF table of coordinates)
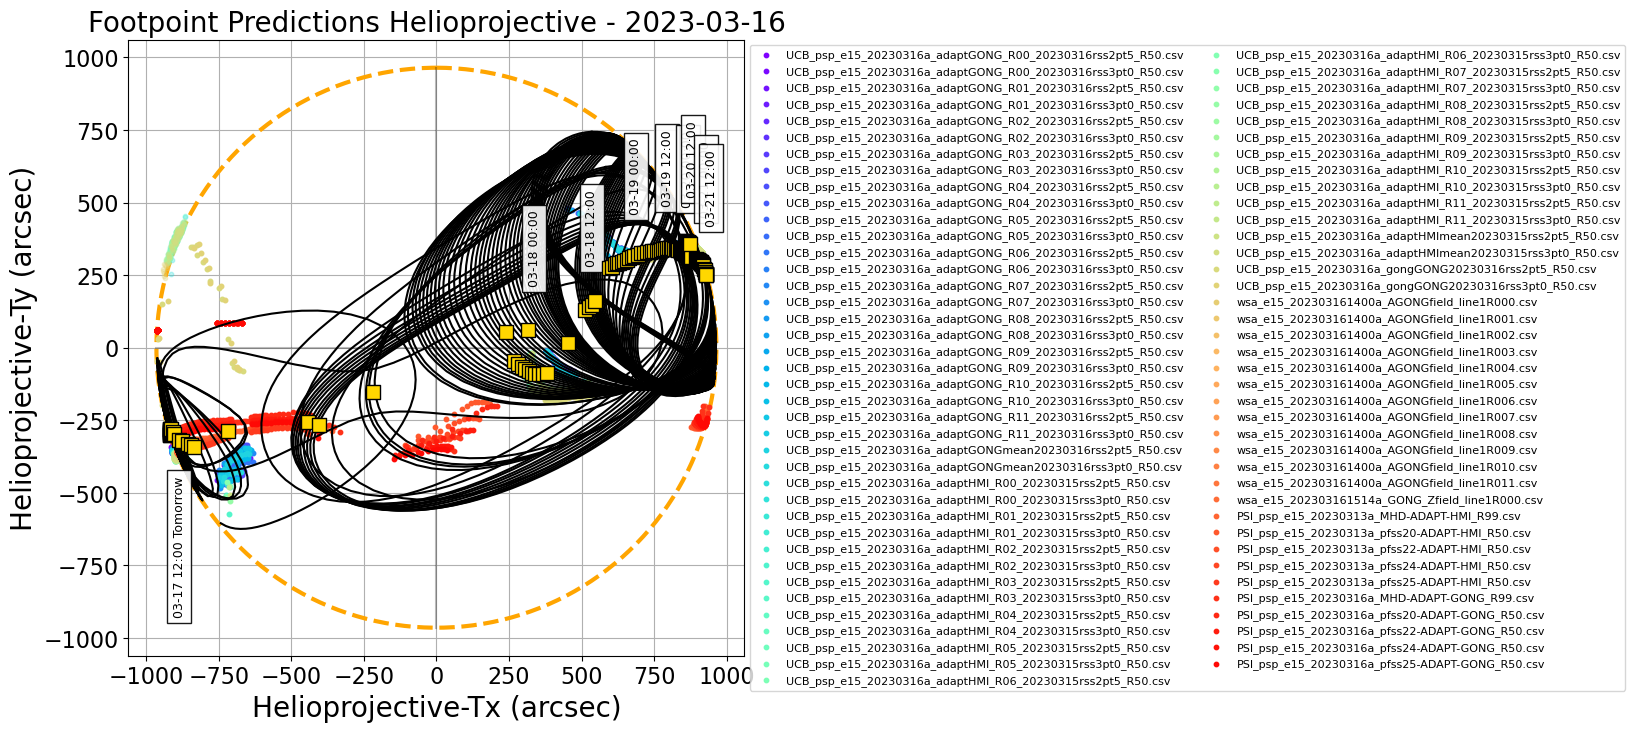
Figure 1.
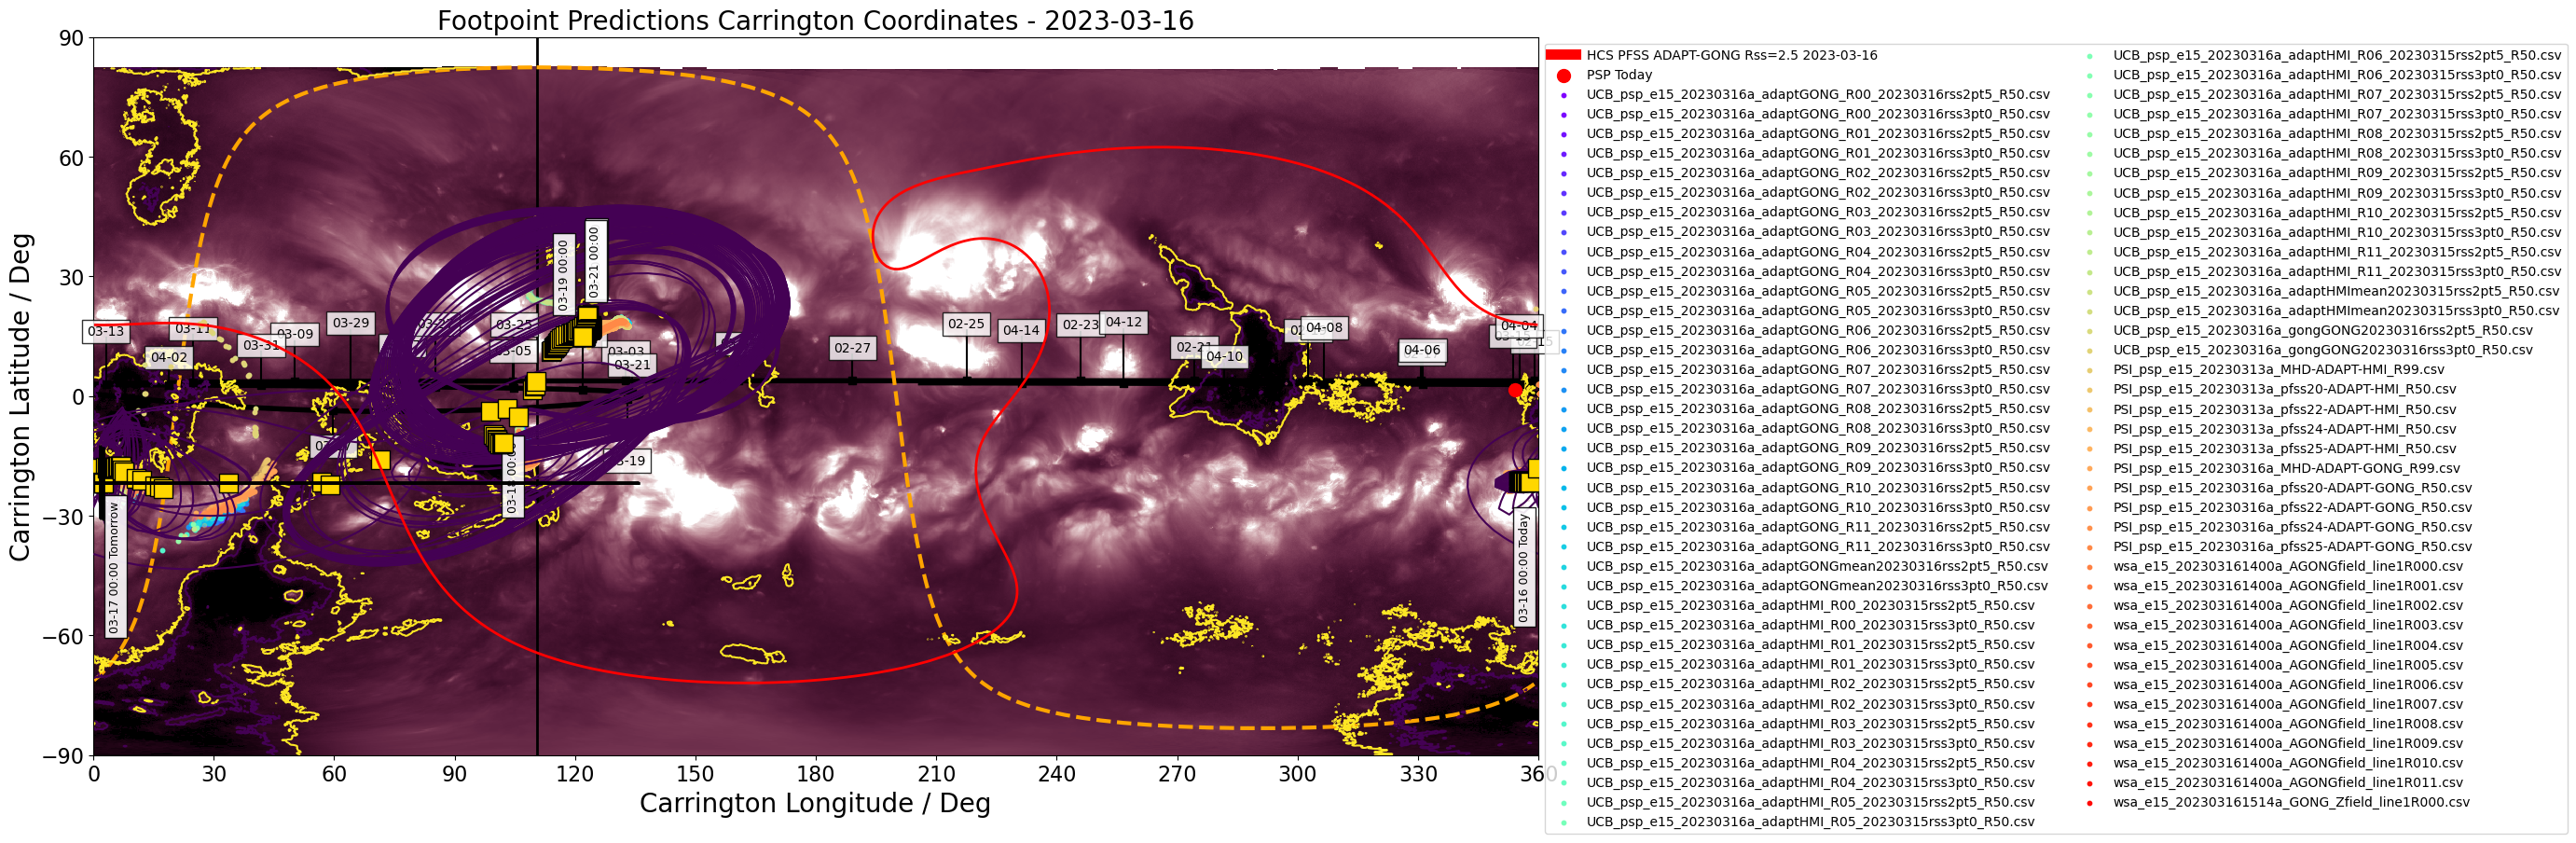
Figure 2.
Figures above show one footpoint per day plotted on the solar disk and in Carrington coordinates (click on figure to zoom and see caption).
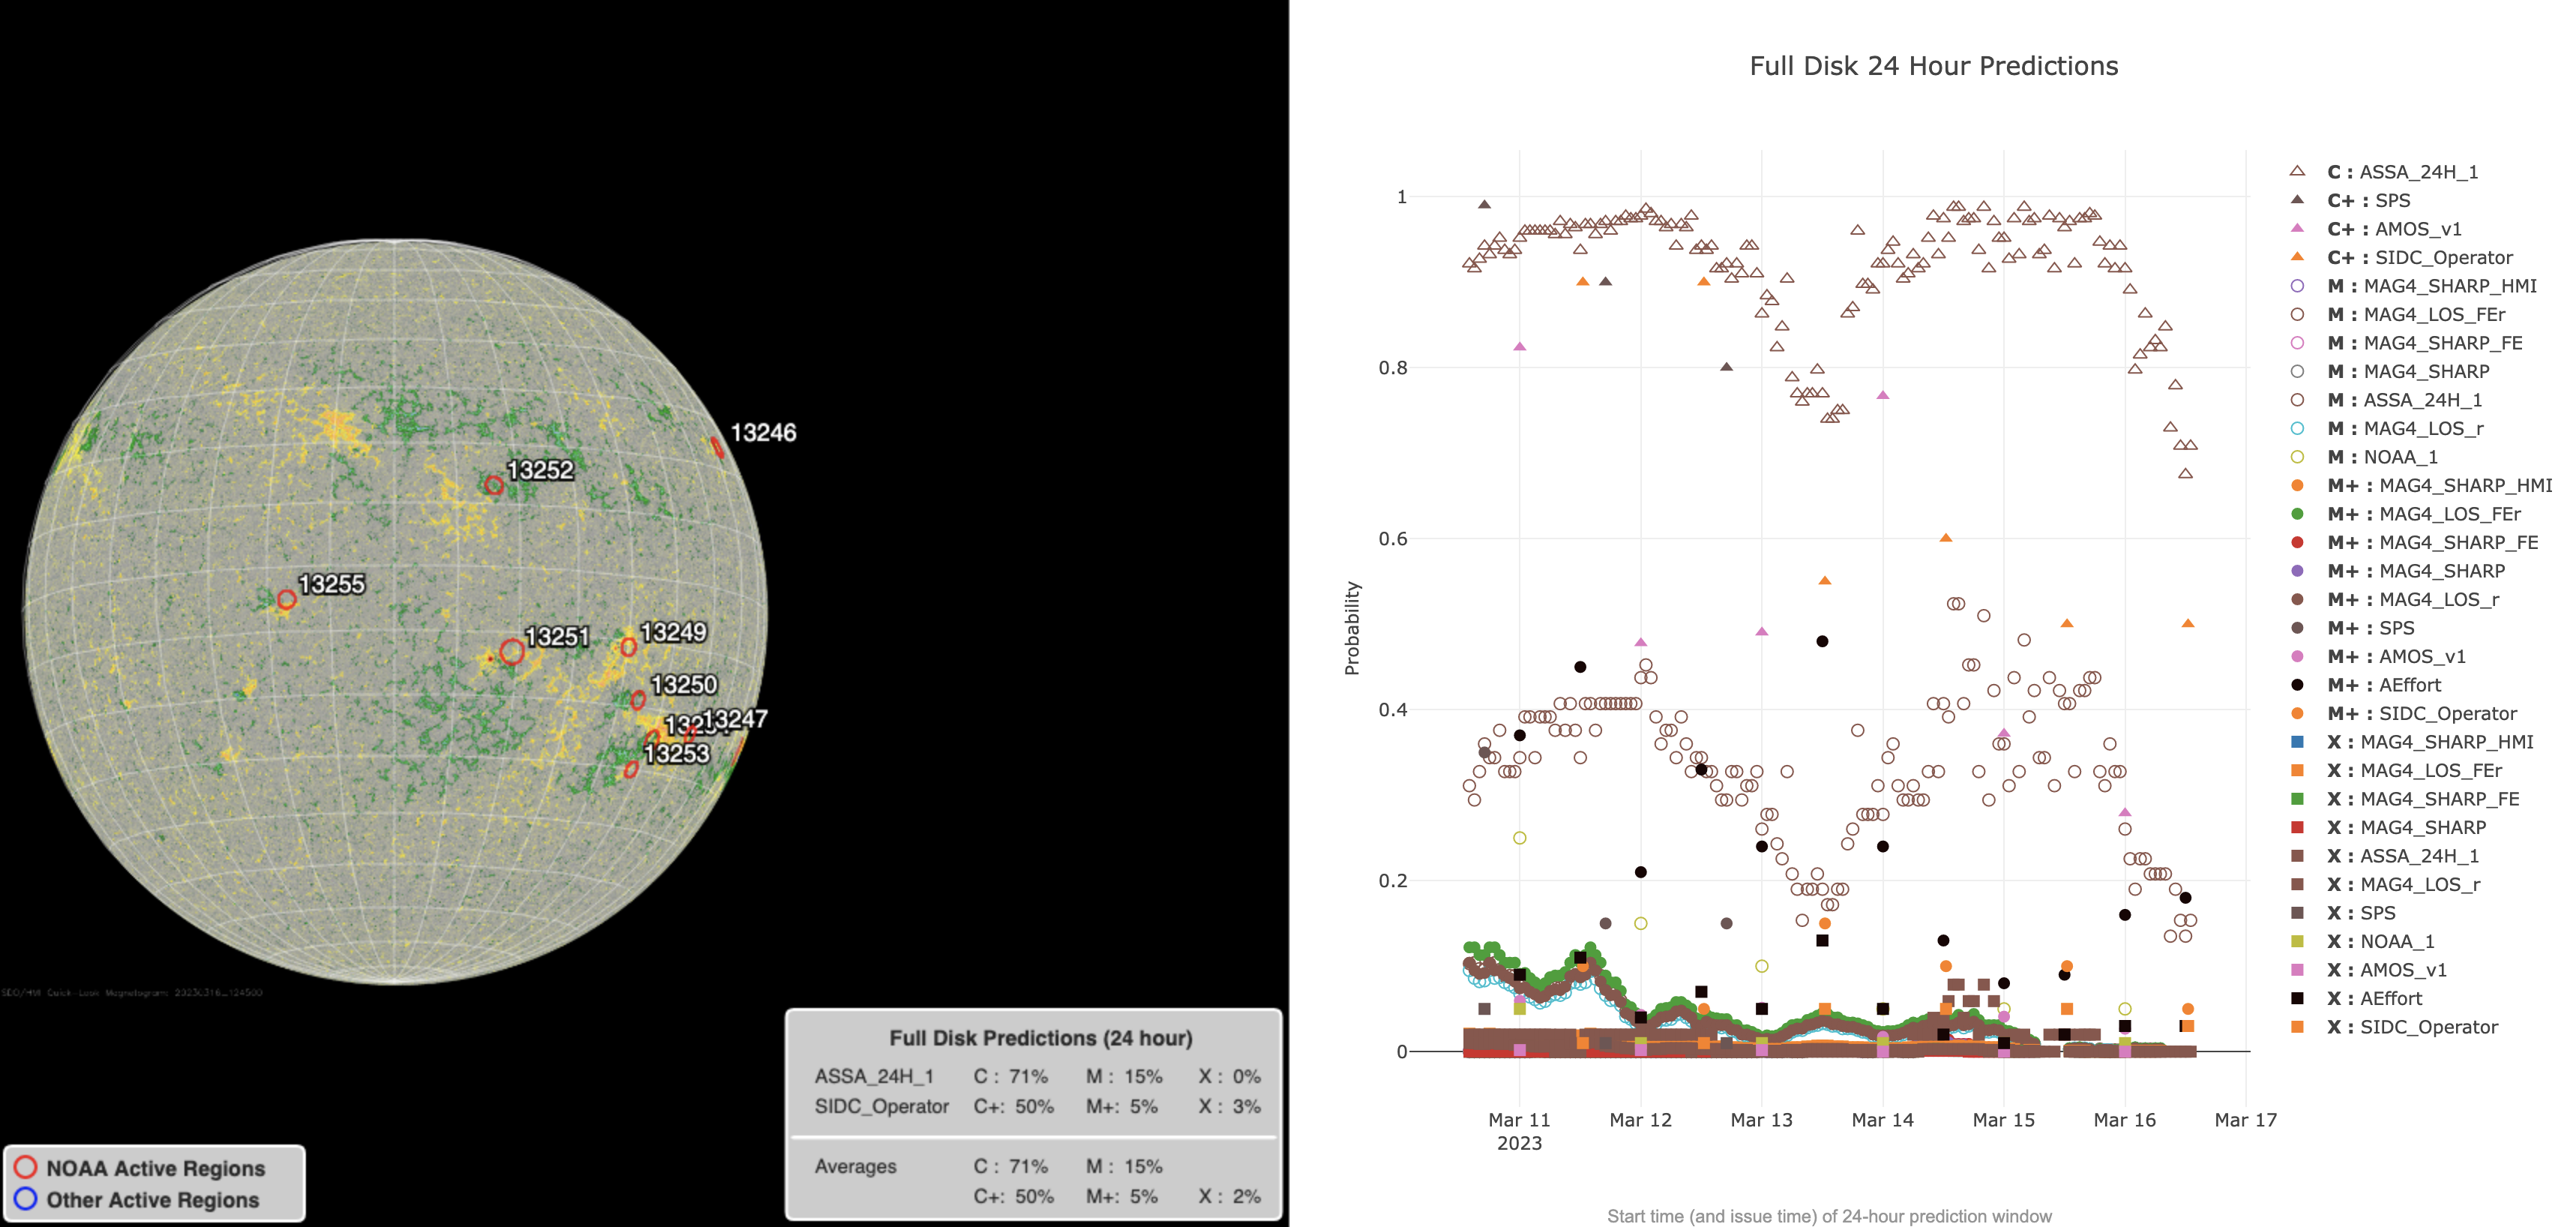
Figure 3.
The predicted footpoints were kindly provided by the PSP 15th Perihelion modeling team.
Encounter 15 Prediction update #2 2023/03/16
Today we start daily updates for PSP's footpoints in support of the fully on-disk 15th solar encounter (Perihelion 03/17). Daily predictions will continue through Tuesday 2023/03/21.
We expect footpoints to emerge on the East limb in the southern polar region around 0200UT on 2023/3/17 and proceed to move rapidly across disk from source to source, reaching the West limb around 2023/3/21 2000UT.
As with Monday's update, the predictions suggest an initial negative polarity connection to what remains of the southern polar coronal hole as it rotates over the East limb. This region is just rotating into view today, and so the magnetogram accuracy for this region is limited.
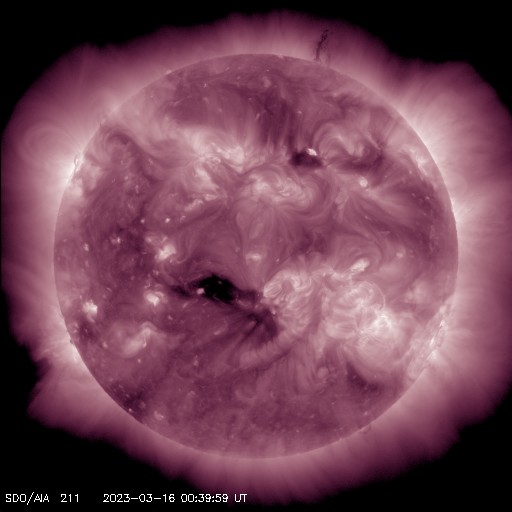
PSP then quickly speeds ahead of the Sun, crossing the HCS and connecting to a coronal hole embedded in the active region bands in the southern mid-latitudes by 0000UT 3/18 and is clearly seen in EUV near disk center today:
https://sdo.gsfc.nasa.gov/assets/img/browse/2023/03/16/20230316_003959_512_0211.jpg. Towards the end of the on disk phase, the source switches to a similar (but still positive polarity) source in the northern mid-latitudes in the active region belt (03/19 through 03/21). This source is less distinct and the models are most likely picking out some locally strong magnetic field in the active regions.
Flare prediction (via CCMC):
While several active regions are on the visible disk, solar activity is very low and models at the CCMC Flare Scoreboard predict low probabilities of flare activity. There is a likelihood of C class flares over the next 24 hours, but very low probabilities of M or greater class flares. The CCMC Flare Scoreboard is consistent with the predictions from the Max Millennium active region/flare targets forecast.
*** Please note that the "arrival time" and "emission time" and associated Tx/Ty coordinates for both reported in the consensus CSV file. The attached plots show the "arrival time" (location of source at time that plasma will arrive at PSP). See https://docs.google.com/presentation/d/1mz02FU24vqKxxLRaJlyScfAh8gB07iOlBsTHApvhls8/edit#slide=id.p for some discussion on these***.
2023-03-17 (CSV, PDF table of coordinates)
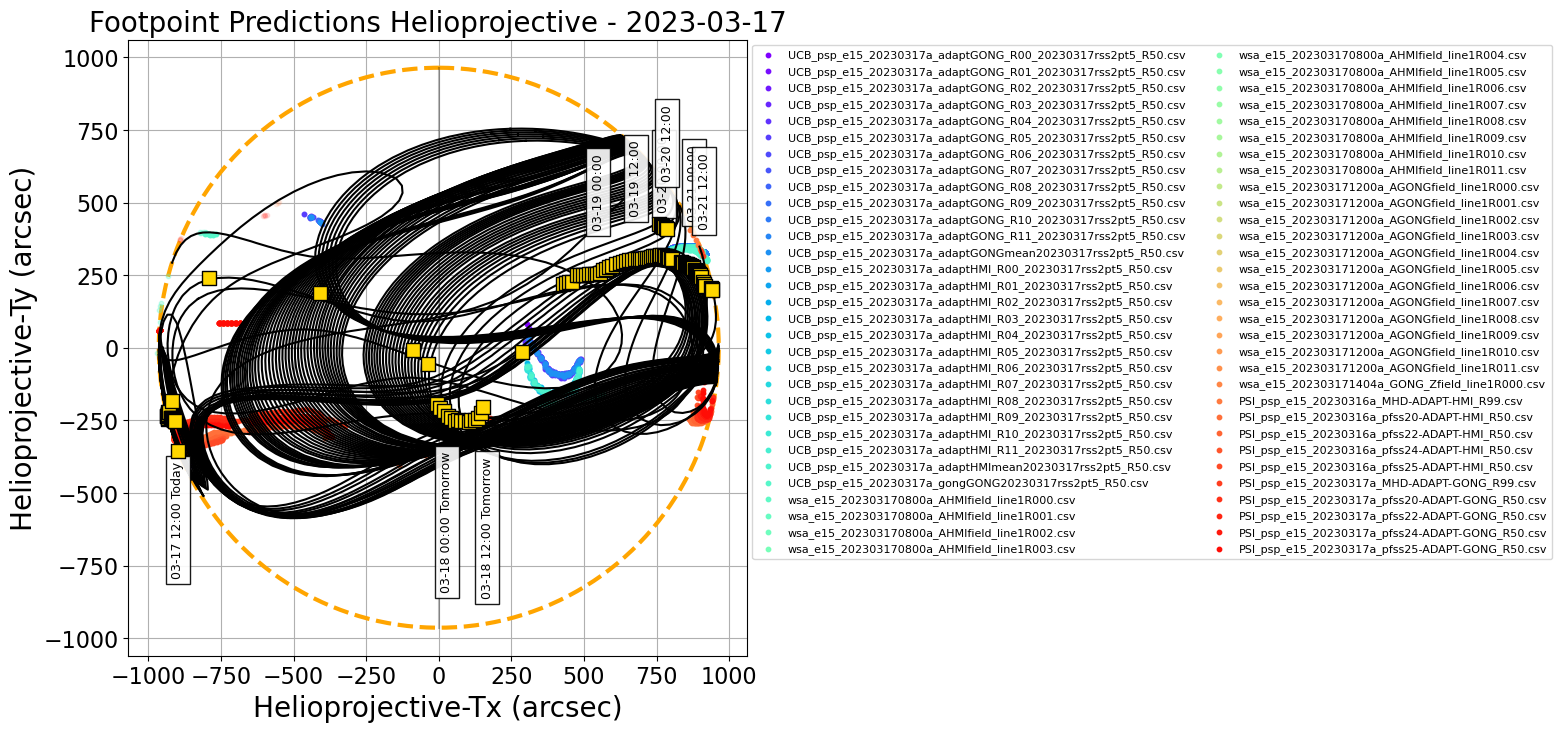
Figure 1.
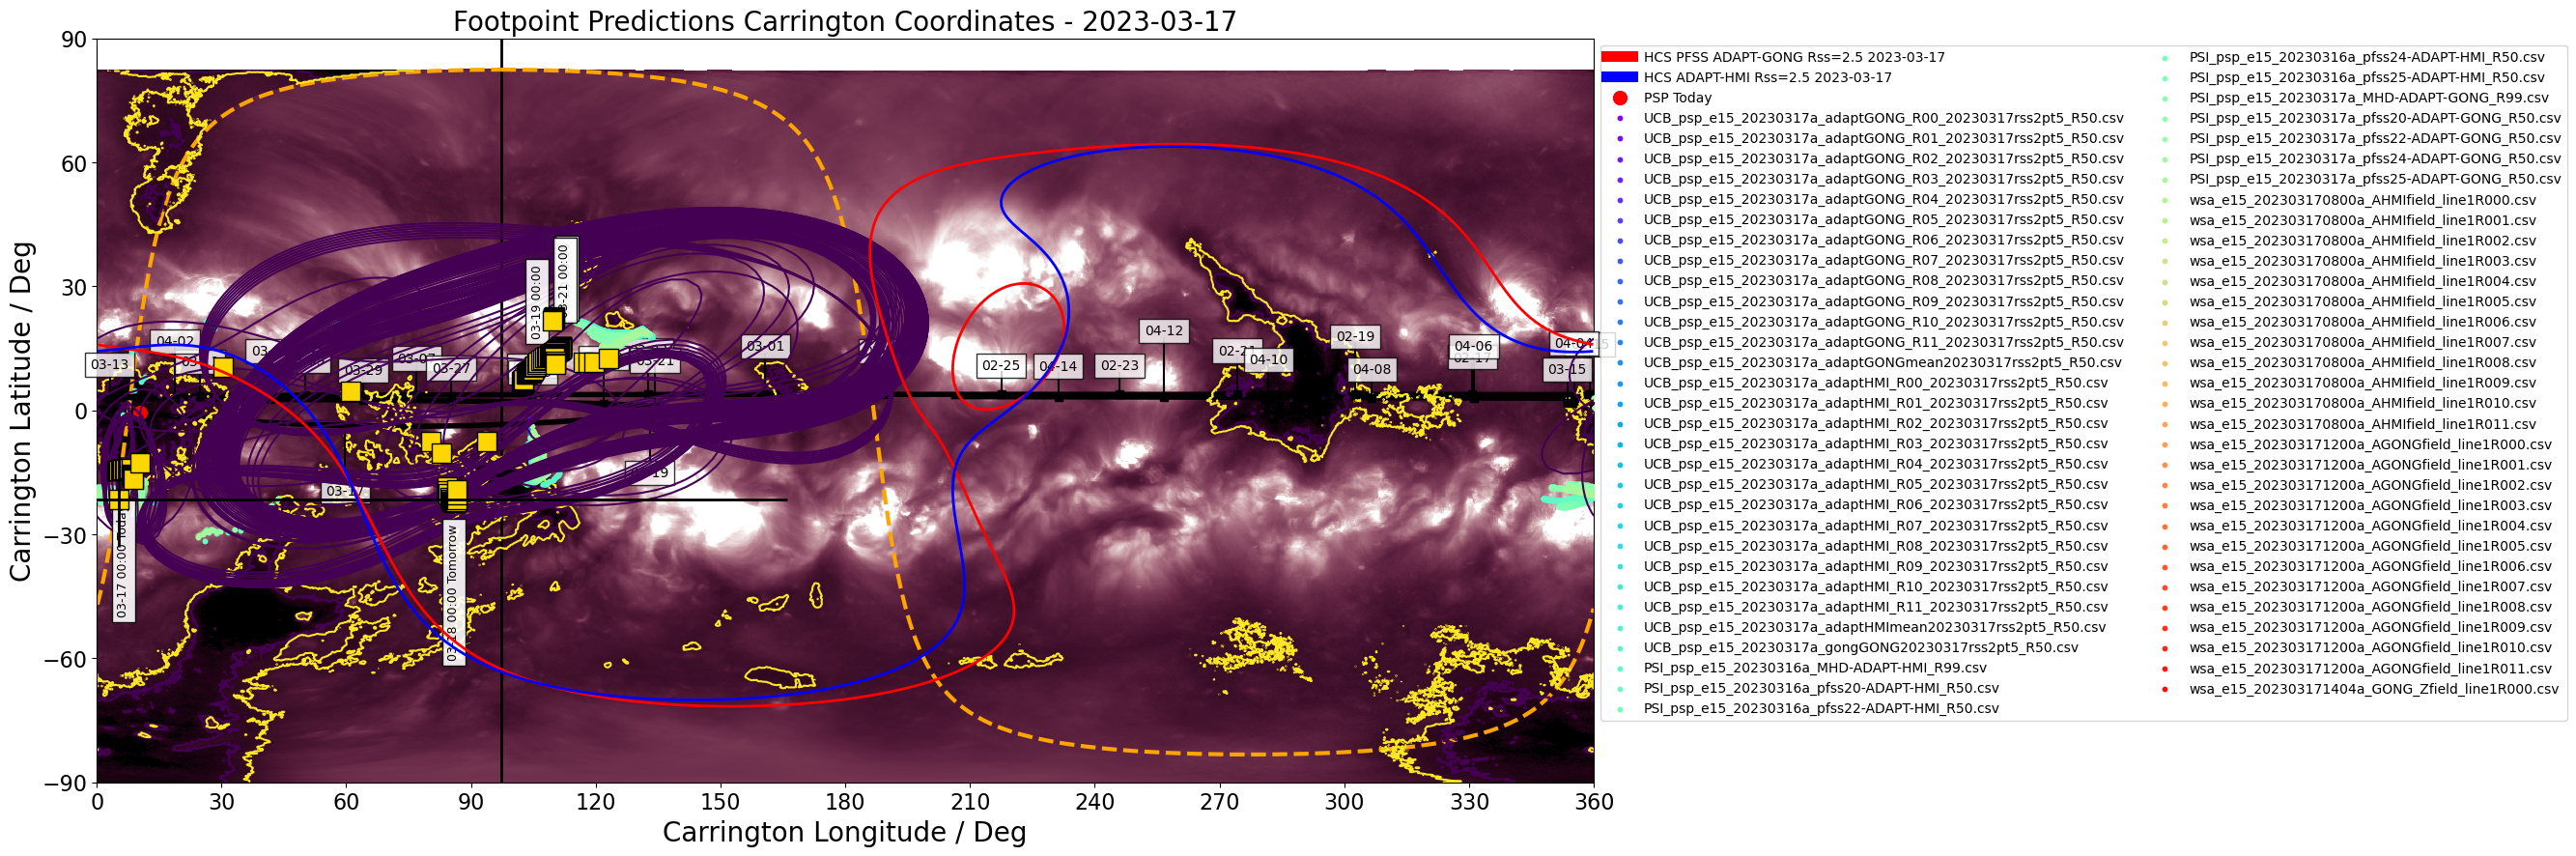
Figure 2.
Figures above show one footpoint per day plotted on the solar disk and in Carrington coordinates (click on figure to zoom and see caption).
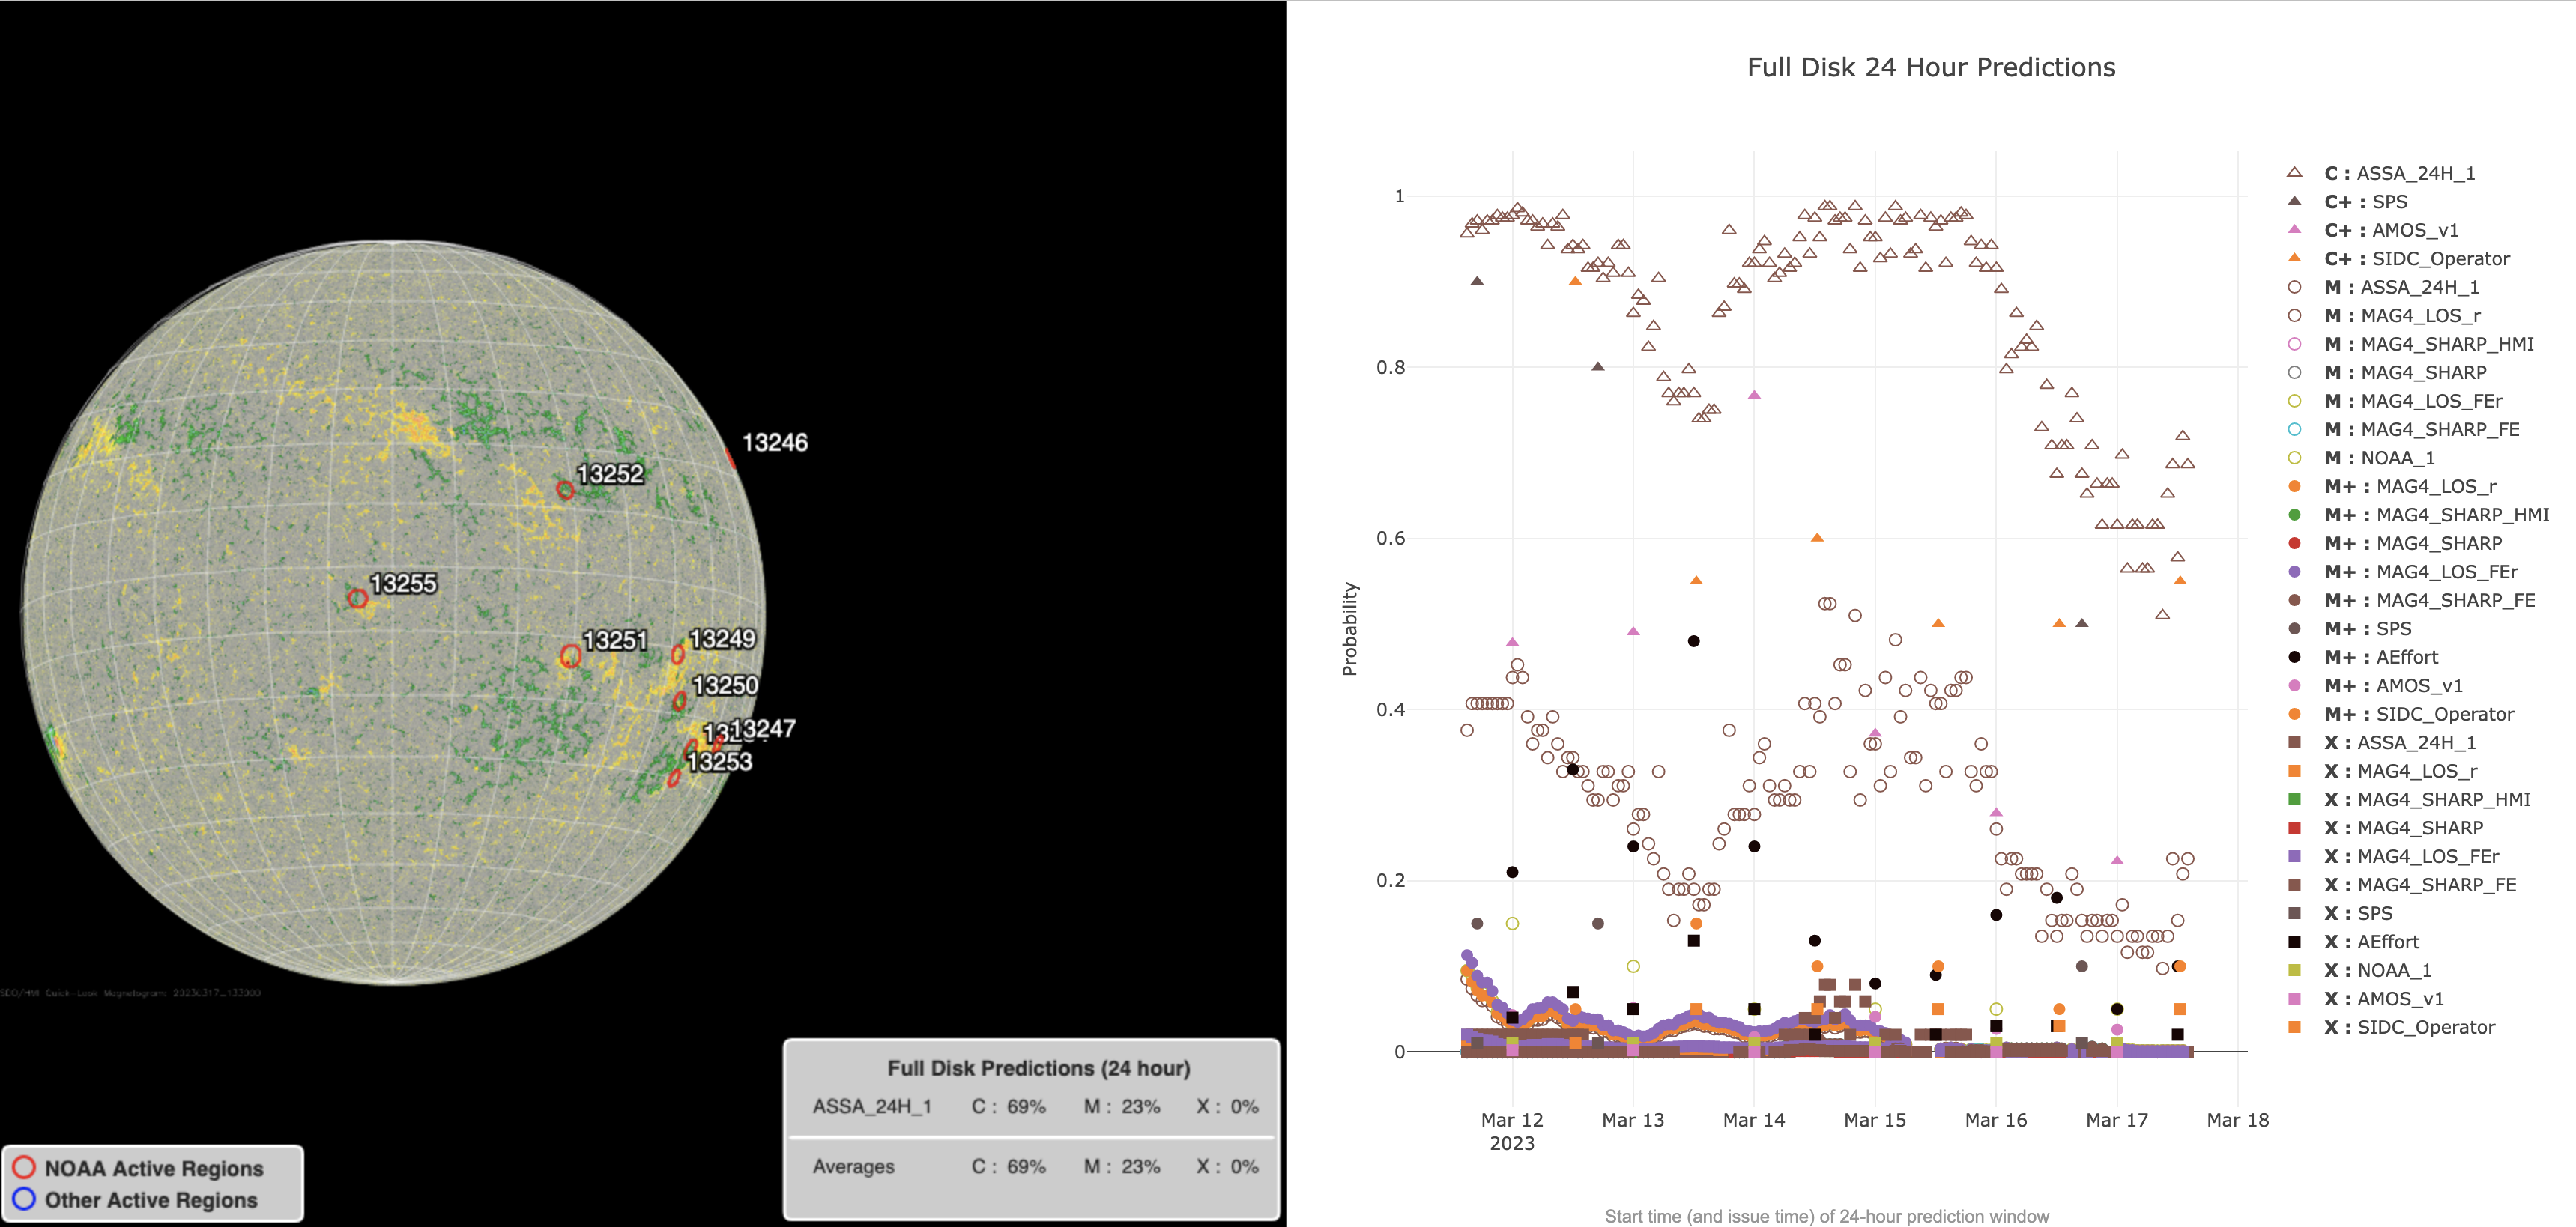
Figure 3.
The predicted footpoints were kindly provided by the PSP 15th Perihelion modeling team.
Encounter 15 Prediction update #3 2023/03/17
Happy perihelion day and happy St Patrick's day!
Predictions will continue to be updated daily through Tuesday 2023/03/21.
Parker's footpoints are now moving with peak angular velocity across the Sun, migrating across the HCS and changing from the Eastern hemisphere to western hemisphere today, and reaching the West limb around 2023/3/21 2000UT.
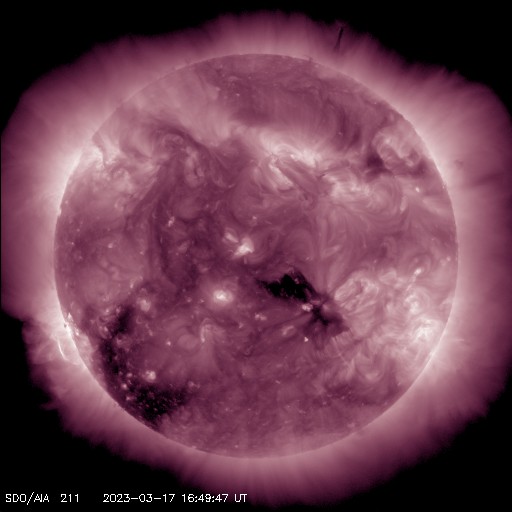
Today's update slightly changes our expectation about the first connection point which has previously pointed to the southern polar coronal hole remnant, which is now visible on disk (https://sdo.gsfc.nasa.gov/assets/img/browse/2023/03/17/20230317_164947_512_0211.jpg). The prediction now points to an initial connection at the equator of the east limb. There is currently no visual evidence of a coronal hole located there but it may still rotate into view. Either way, that connectivity is likely only valid through today around 6pm UT today, the time this prediction is issued, and the connection point changes extremely rapidly through the next 24 hours.
The subsequent connectivity is better constrained, although the time of transition from source to source varies between models leading to the large error ellipses shown in the prediction plots. By evening UT tomorrow (3/18), the forecast is still to the equatorial CH seen now just right of disk center (see link to image above). As part of the transition to this source Parker should cross the HCS from negative to positive polarity.
Finally, towards the end of UT day 3/19, the connectivity switches again to northern mid-latitudes to the active region band. As reported yesterday, a specific coronal hole in that location is not clearly seen in EUV.
Flare prediction (via CCMC):
Several active regions remain on the visible disk with low activity. Models at the CCMC Flare Scoreboard predict low probabilities of flare activity, although slightly higher than yesterday. These results are consistent with the forecast from Max Millennium. As noted in the Max Millennium forecast (http://solar.physics.montana.edu/pipermail/mmmotd/2023-March/004455.html), a yet unnumbered region in the Southeast limb has been producing several C-class flares in the last 24 hours, and has some chance of producing a low M-class flare in the next 24 hours.
*** Please note the "arrival time" and "emission time" and associated Tx/Ty coordinates for both reported in the consensus CSV file. The attached plots show the "arrival time" (location of source at time that plasma will arrive at Parker). See https://docs.google.com/presentation/d/1mz02FU24vqKxxLRaJlyScfAh8gB07iOlBsTHApvhls8/edit#slide=id.p for some discussion on these***.
2023-03-18 (CSV, PDF table of coordinates)
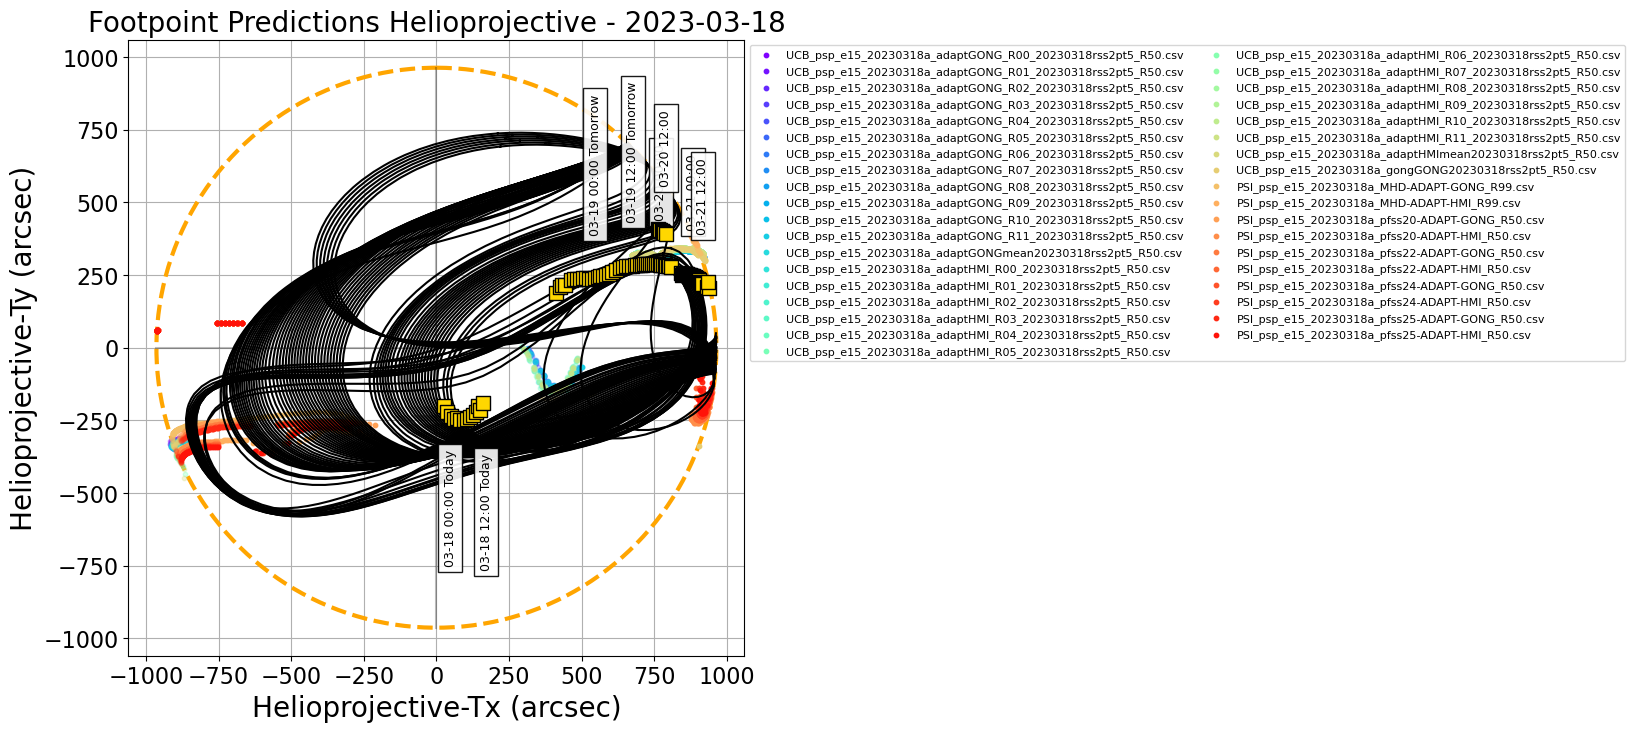
Figure 1.
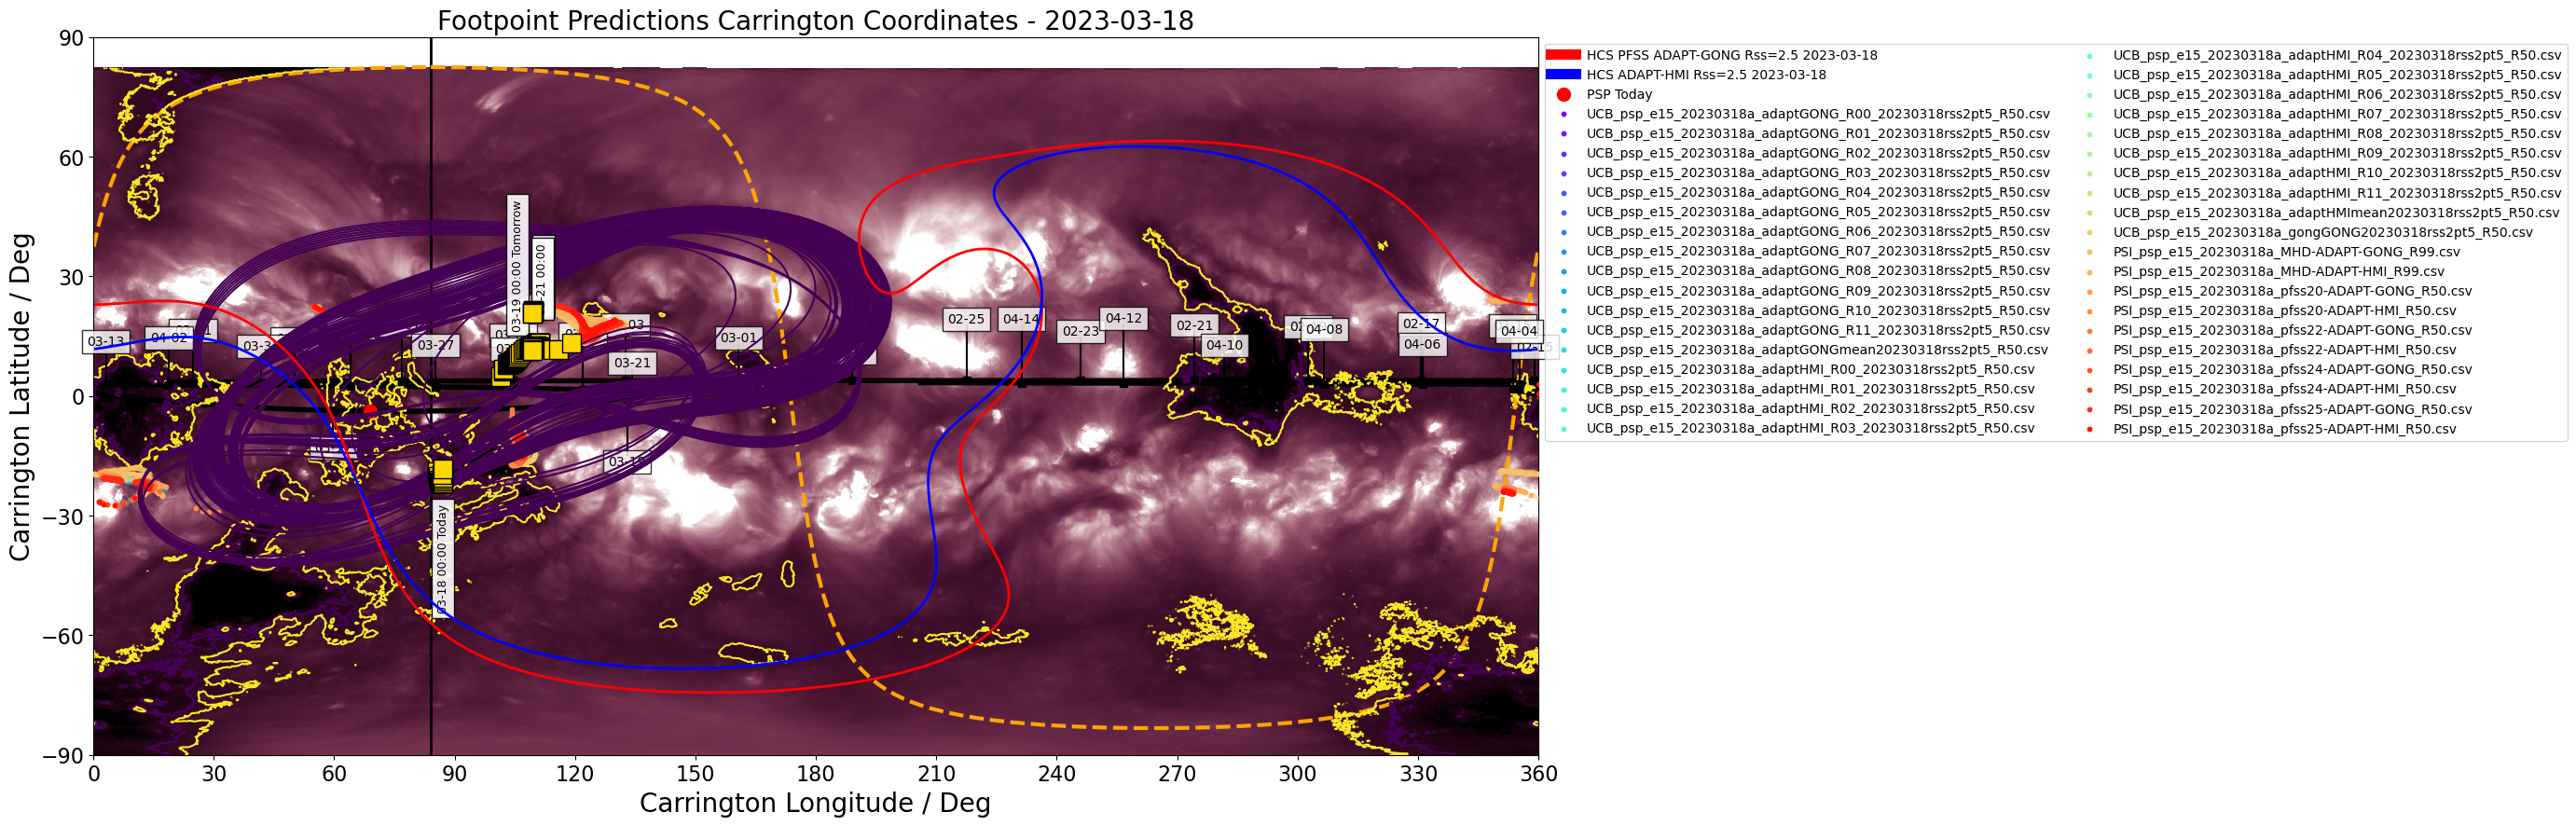
Figure 2.
Figures above show one footpoint per day plotted on the solar disk and in Carrington coordinates (click on figure to zoom and see caption).
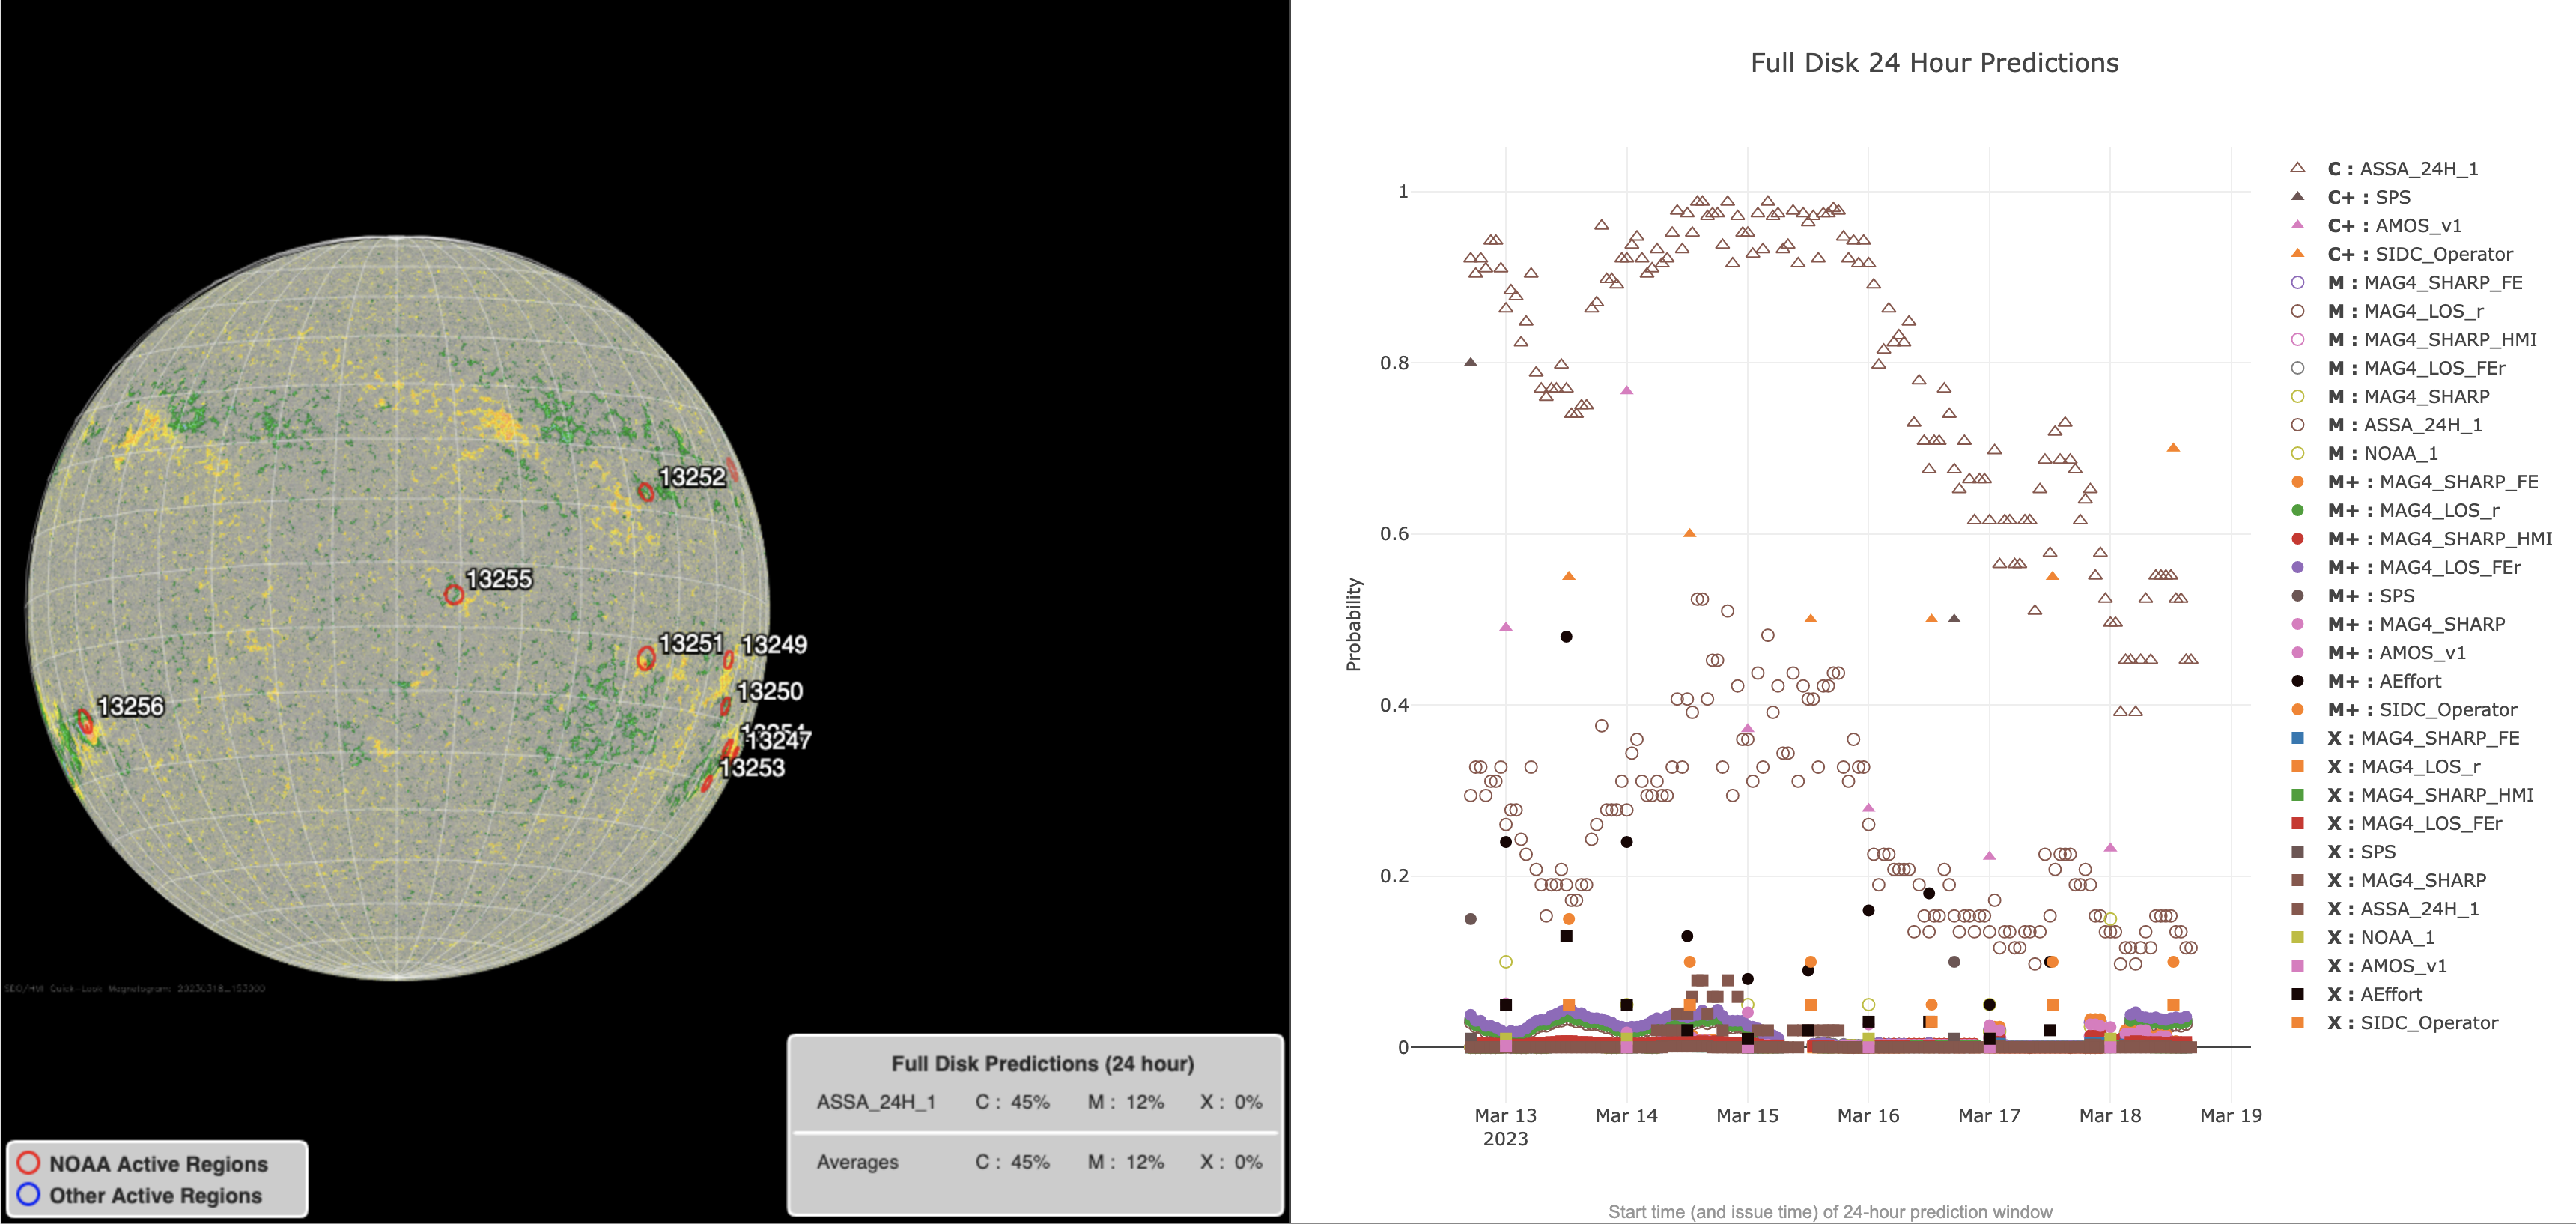
Figure 3.
The predicted footpoints were kindly provided by the PSP 15th Perihelion modeling team.
Encounter 15 Prediction update #4 2023/03/18
Predictions will continue to be updated daily through Tuesday 2023/03/21.
Parker's footpoints are still moving rapidly westwards across the Sun, are currently located in the Western hemisphere and will reaching the West limb around 2023/3/21 2000UT.
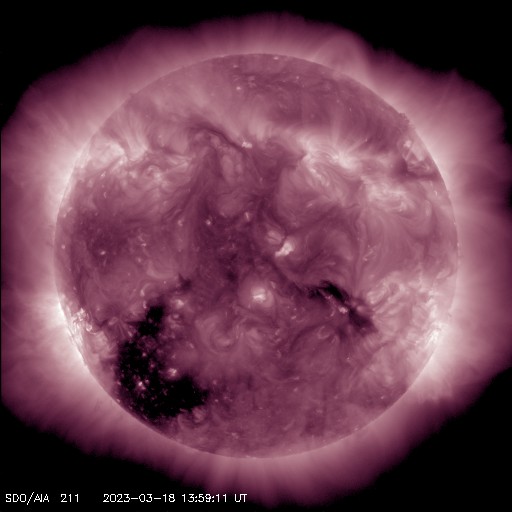
Today's update remains stable from yesterday but suggests the connectivity at the time of issuing will have already switched from the near disk center equatorial coronal hole (see https://sdo.gsfc.nasa.gov/assets/img/browse/2023/03/18/20230318_135911_512_0211.jpg) to the northern mid-latitudes active region complex seen in the top right quadrant of the linked image. Predictions suggest the footpoints remain there as Parker's angular motion gradually slows, migrating westwards over that complex towards the limb through Tuesday 3/21.
Flare prediction (via CCMC):
Solar activity remains low to moderate. Predictions from the CCMC Flare Scoreboard are currently estimating a low probability of M-class or higher flare activity from the visible disk, consistent with predictions from Max Millennium. C-class flares are expected over the next 24 hours.
*** Please note the "arrival time" and "emission time" and associated Tx/Ty coordinates for both reported in the consensus CSV file. The attached plots show the "arrival time" (location of source at time that plasma will arrive at Parker). See https://docs.google.com/presentation/d/1mz02FU24vqKxxLRaJlyScfAh8gB07iOlBsTHApvhls8/edit#slide=id.p for some discussion on these***.
2023-03-19 (CSV, PDF table of coordinates)
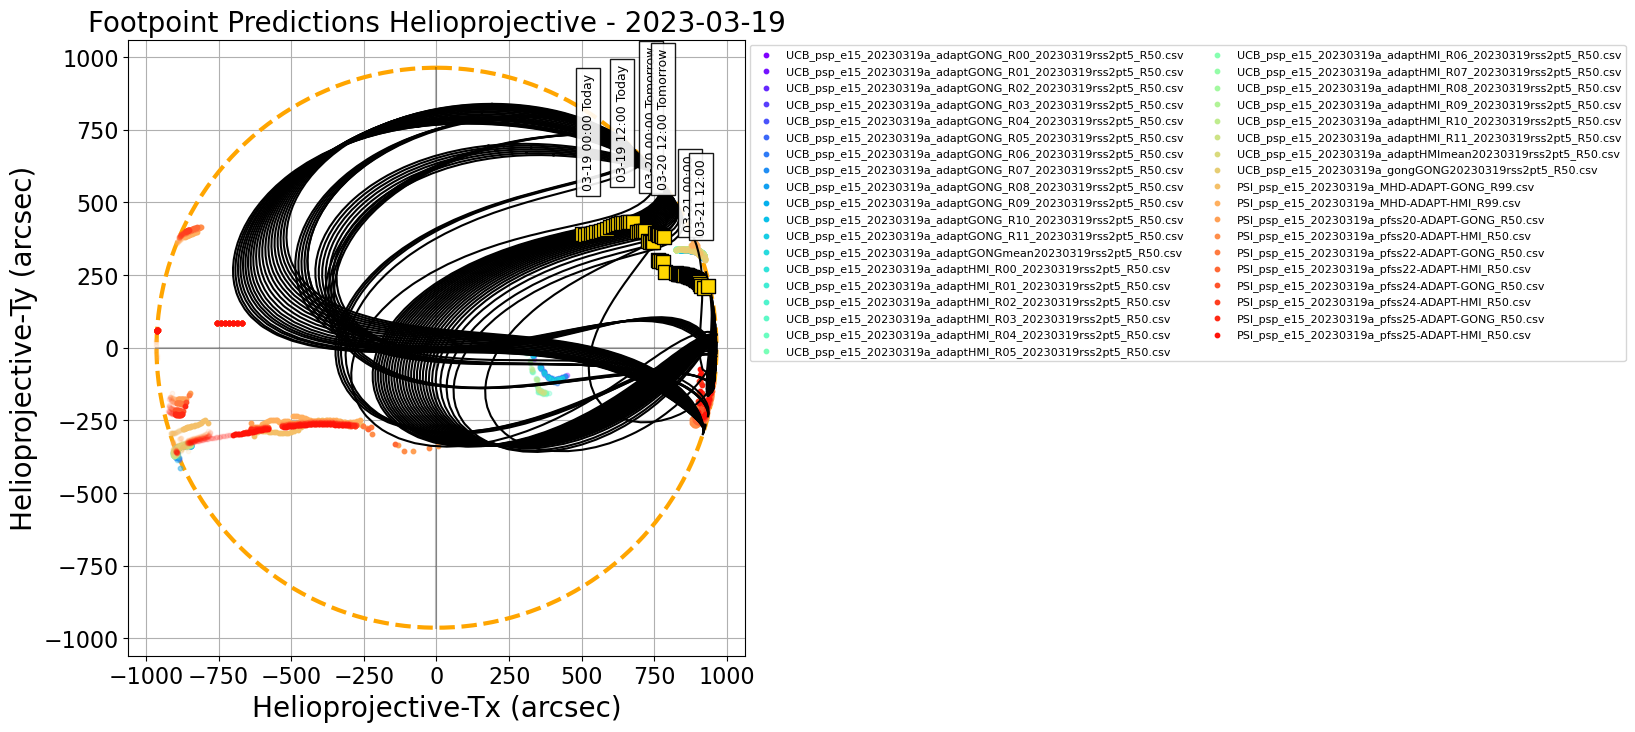
Figure 1.
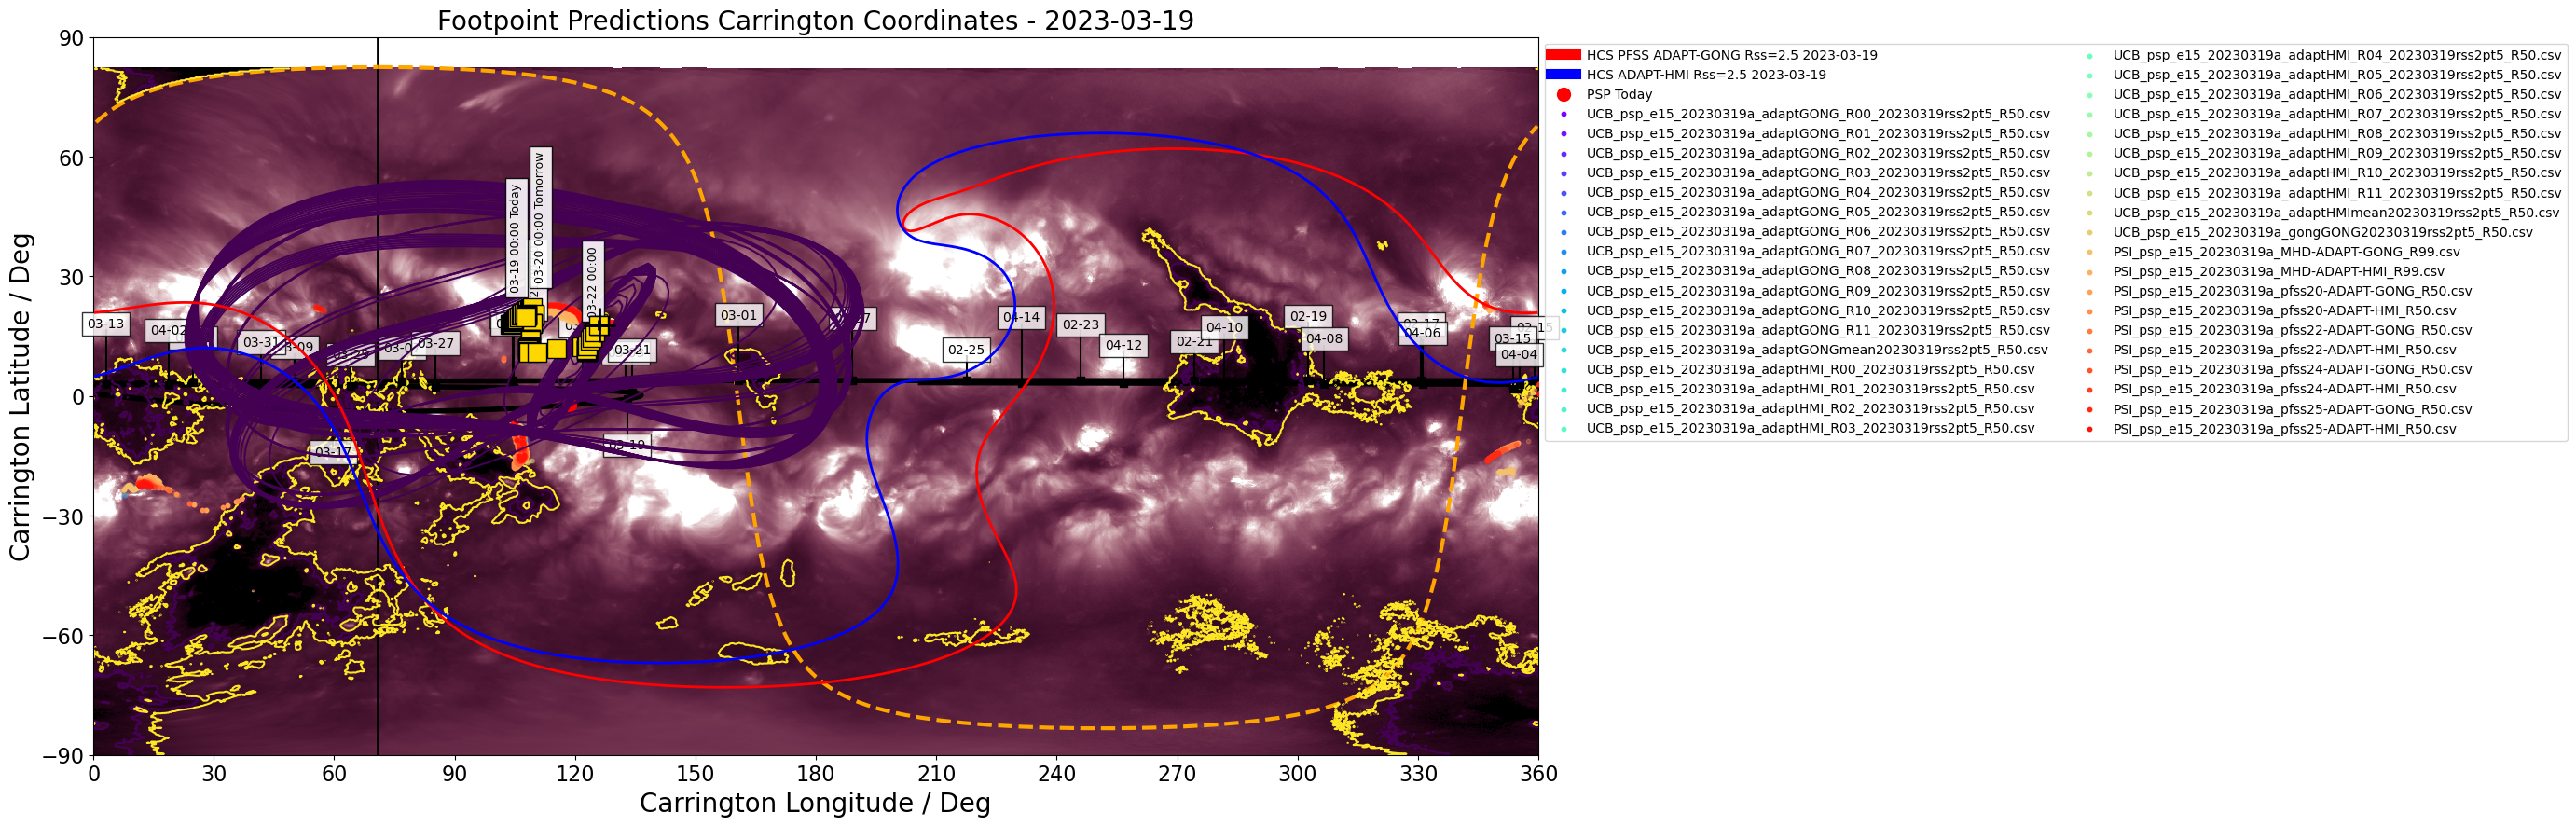
Figure 2.
Figures above show one footpoint per day plotted on the solar disk and in Carrington coordinates (click on figure to zoom and see caption).
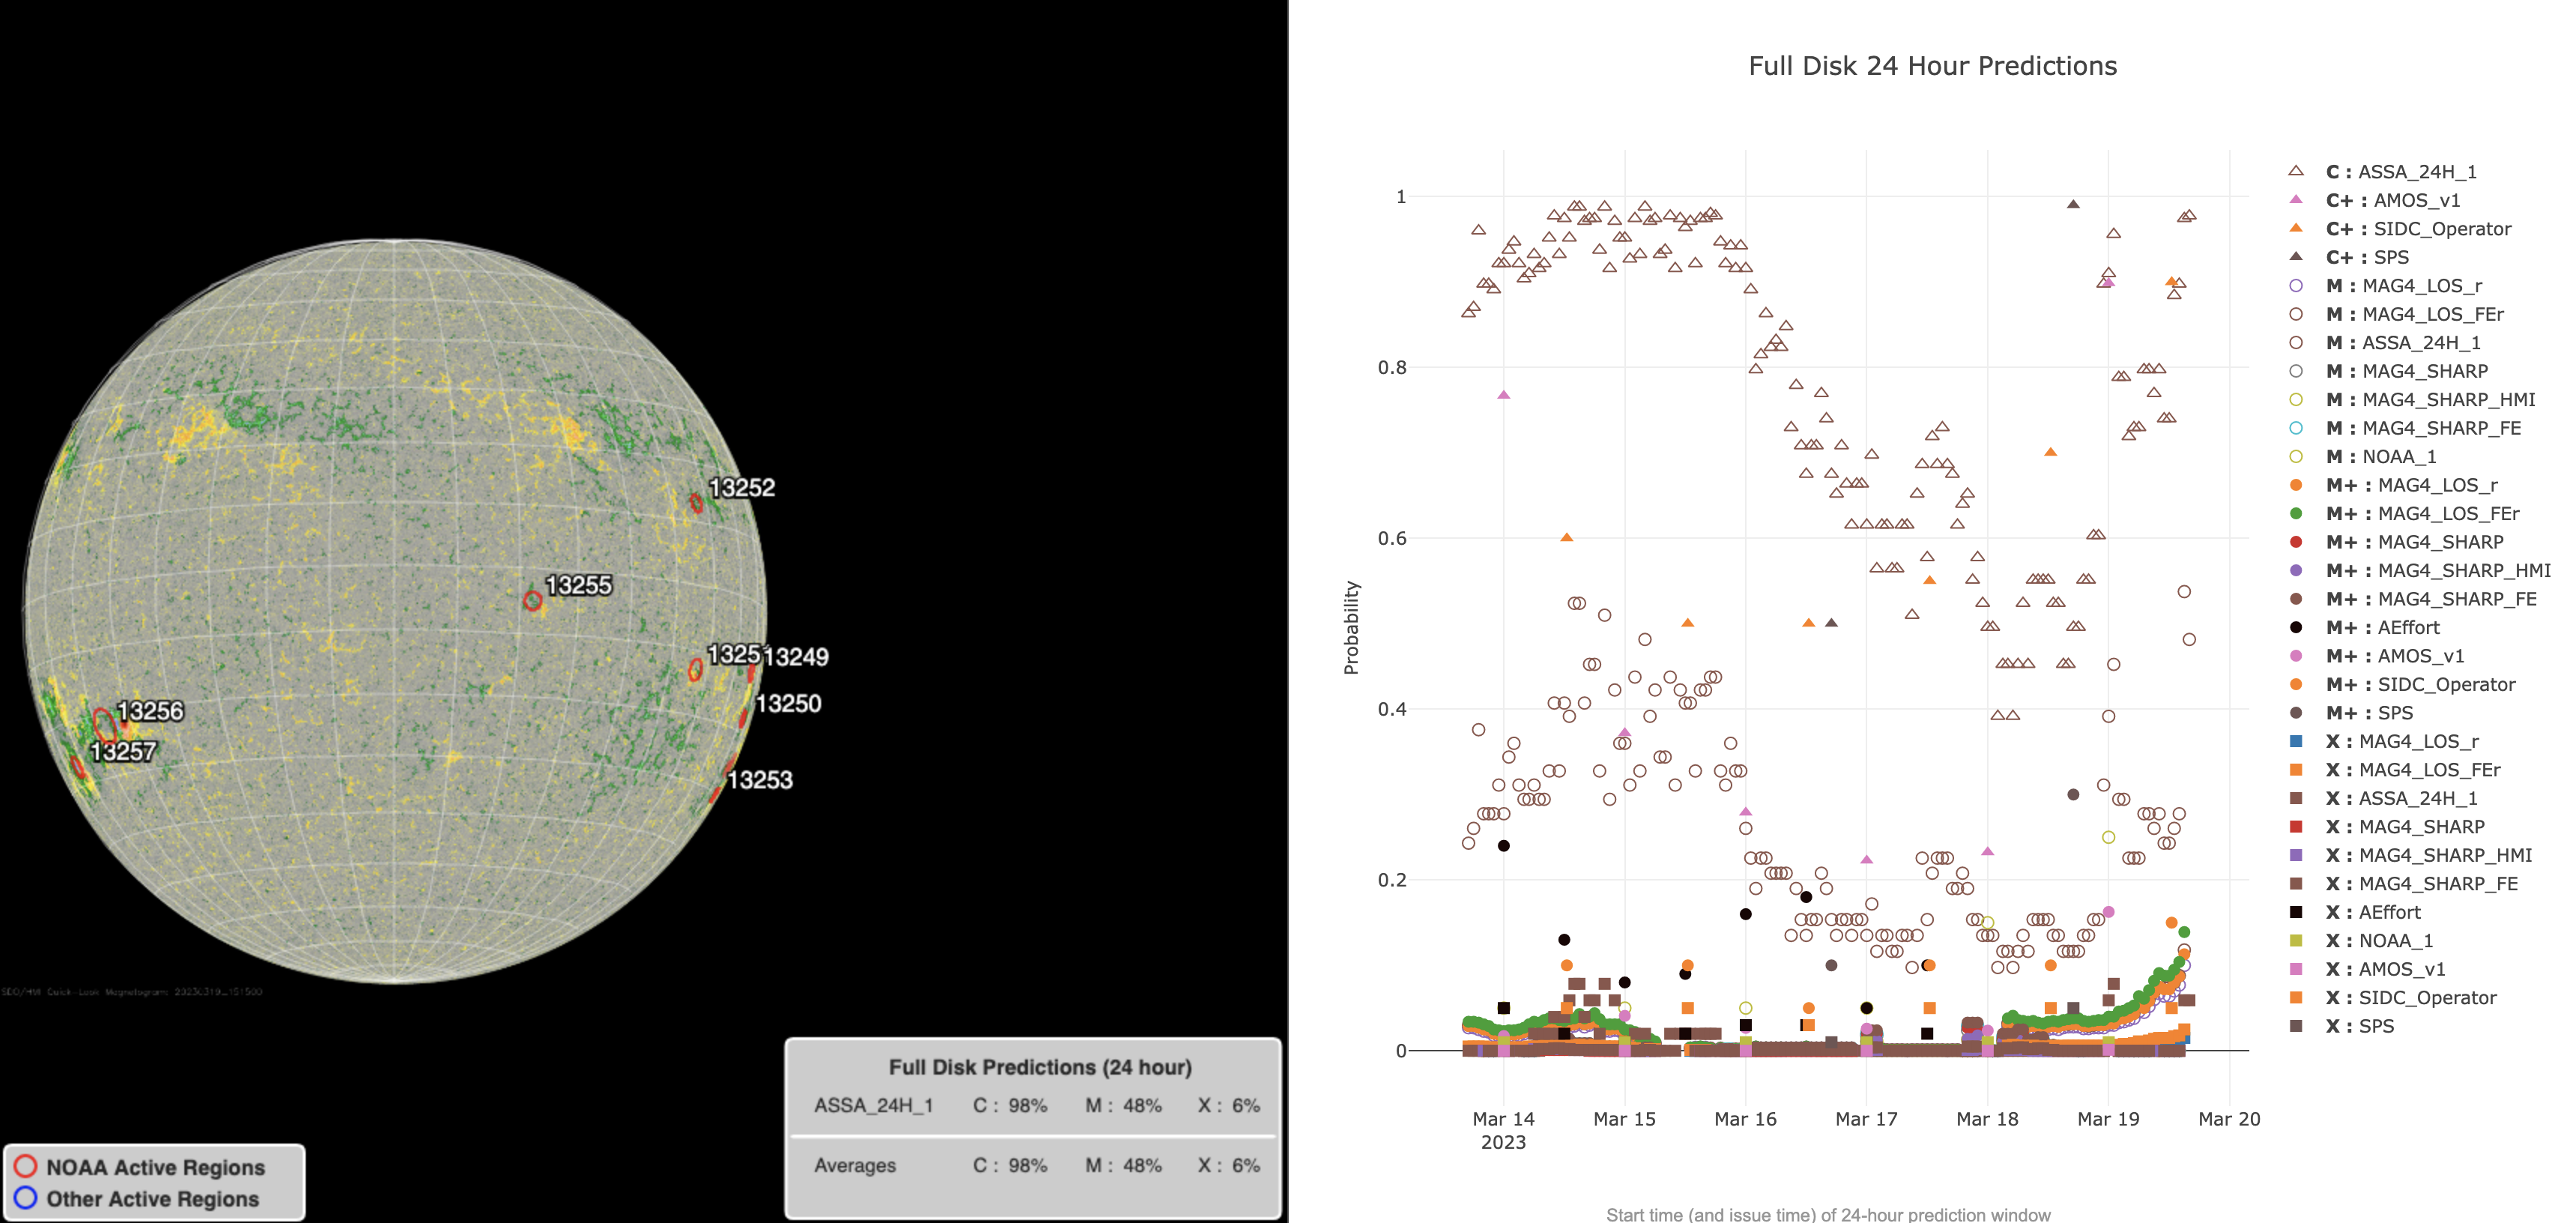
Figure 3.
The predicted footpoints were kindly provided by the PSP 15th Perihelion modeling team.
Encounter 15 Prediction update #5 2023/03/19
Remaining predictions will be issued today, tomorrow (3/20) and Tuesday (3/21).
Parker's footpoints are still moving westwards across the Sun in the northern mid-latitude active region band but gradually slowing to near co-rotation, reaching the West limb around 2023/3/21 2000UT.
Today's update:
Model results are stable from yesterday and suggest a consistent source through the rest of the on-disk phase. Connection remains tied to a strong field concentration in the northern mid-latitude active region band and will stay there through Tuesday, essentially corotating with the Sun off the limb by evening UT of 03/21 (Tuesday).
Flare prediction (via CCMC):
Solar activity remains low-to-moderate. Predictions from the CCMC Flare Scoreboard are currently estimating a slight probability of M-class flares from the visible disk (48%) and a high chance of C-class flares (98%). There is a low probability for X-class flares (6%). Max Millennium is focusing on AR 13256 and AR 13257 for flare observations.
*** Please note the "arrival time" and "emission time" and associated Tx/Ty coordinates for both reported in the consensus CSV file. The attached plots show the "arrival time" (location of source at time that plasma will arrive at Parker). See https://docs.google.com/presentation/d/1mz02FU24vqKxxLRaJlyScfAh8gB07iOlBsTHApvhls8/edit#slide=id.p for some discussion on these***.
2023-03-20 (CSV, PDF table of coordinates)
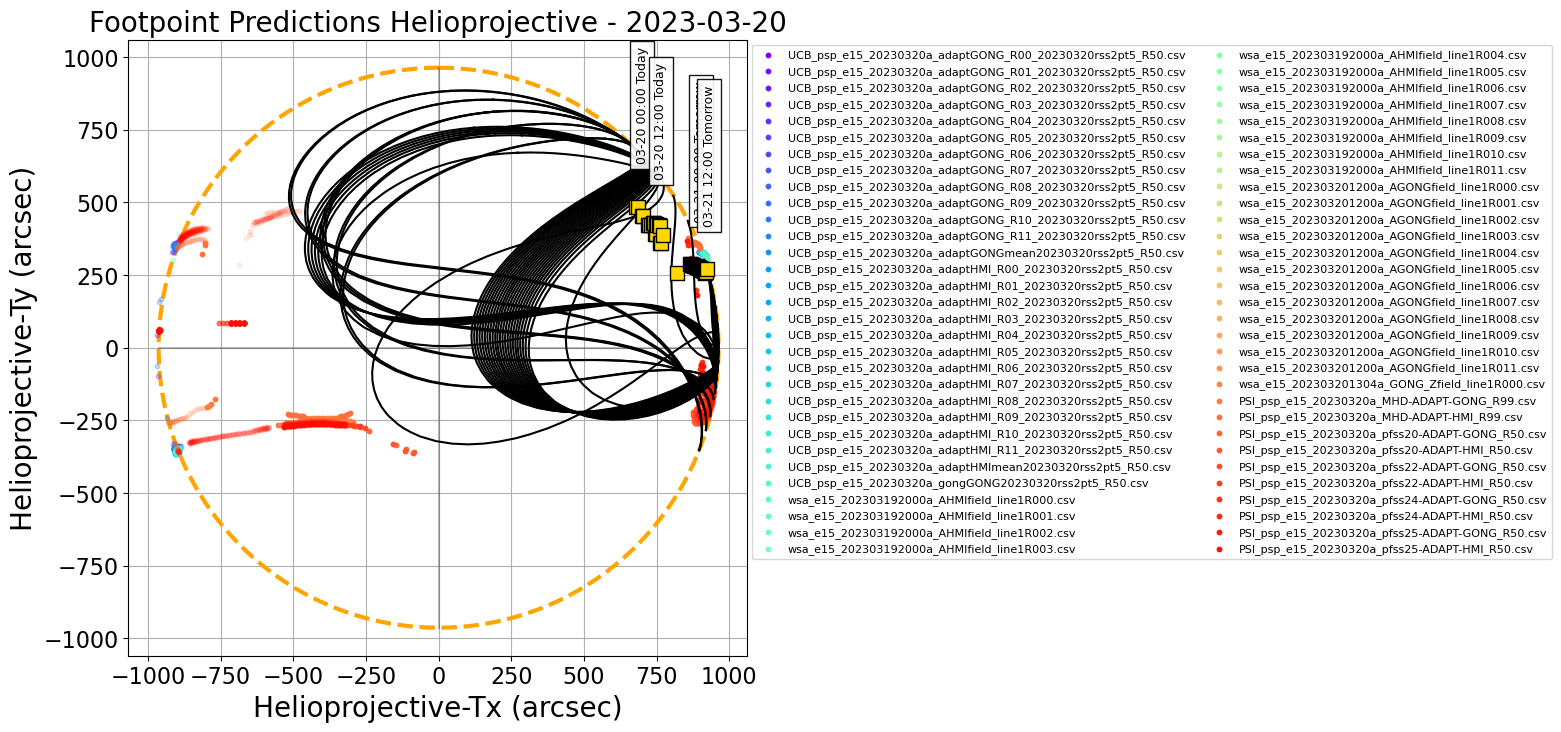
Figure 1.
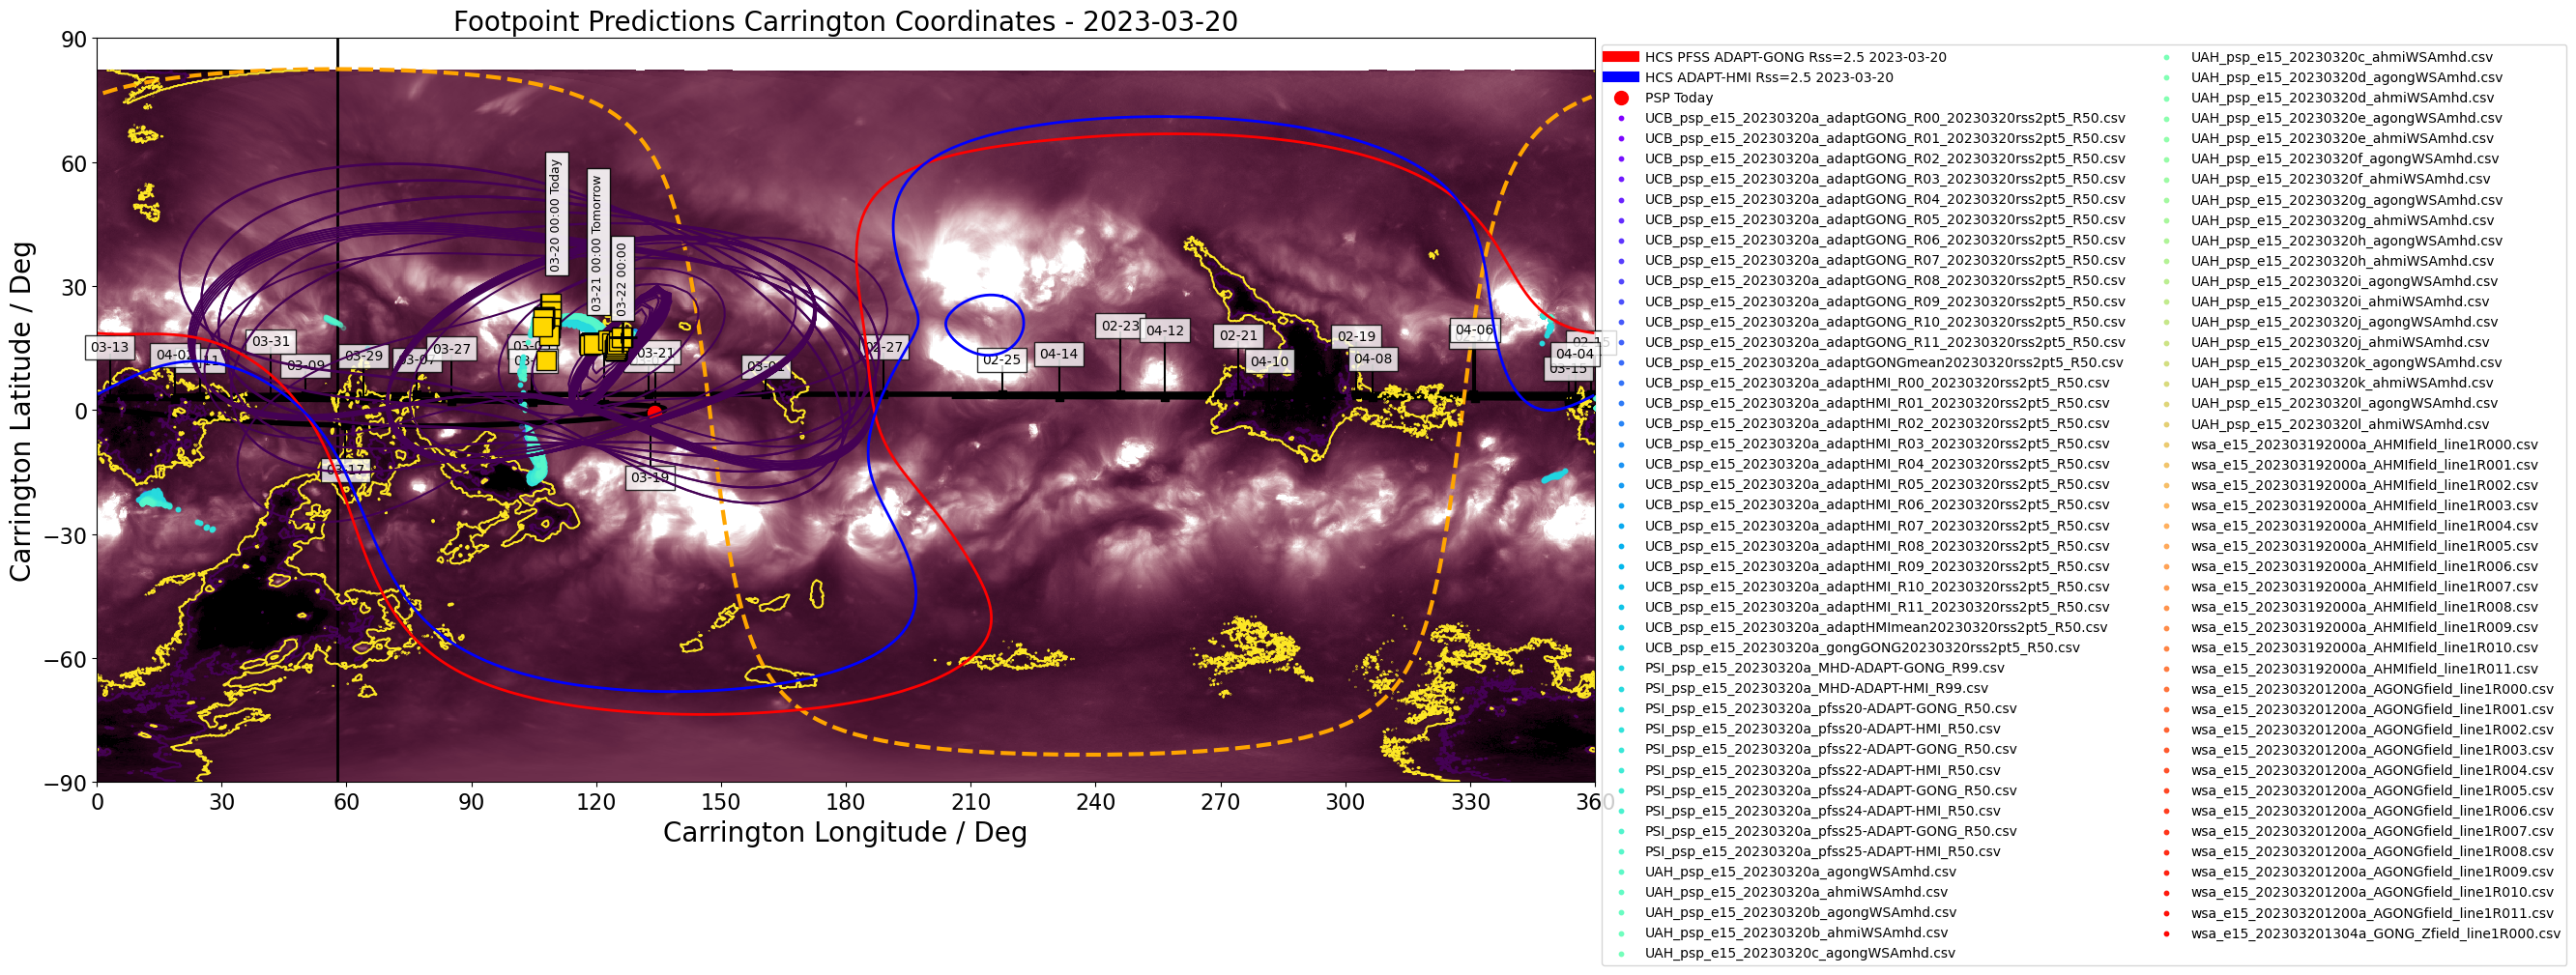
Figure 2.
Figures above show one footpoint per day plotted on the solar disk and in Carrington coordinates (click on figure to zoom and see caption).

Figure 3.
The predicted footpoints were kindly provided by the PSP 15th Perihelion modeling team.
Encounter 15 Prediction update #6 2023/03/20
This is the penultimate prediction update for E15, the last one will be tomorrow 3/21.
Predictions of Parker's footpoints remain in the northern mid-latitude active region and are now near the West limb and will rotate off disk in the next 24 hours.
Today's update:
Predictions remain steady with connection in the northern mid-latitude active region band near the West limb. Parker is slowing into co-rotation now, and so the footpoints will remain close to the same Carrington longitude as the Sun rotates, gradually reaching the West limb by 3/21 1900UT.
Flare prediction (via CCMC):
Solar activity remains moderate-to-low. Predictions from the CCMC Flare Scoreboard are currently estimating a slight probability of M-class flares from the visible disk (41%) and a high chance of C-class flares (94%). There is a low probability for X-class flares (2%). Max Millennium is focusing on AR 13256 and AR 13257 for flare observations.
*** Please note the "arrival time" and "emission time" and associated Tx/Ty coordinates for both reported in the consensus CSV file. The attached plots show the "arrival time" (location of source at time that plasma will arrive at Parker). See https://docs.google.com/presentation/d/1mz02FU24vqKxxLRaJlyScfAh8gB07iOlBsTHApvhls8/edit#slide=id.p for some discussion on these***.
2023-03-21 (CSV, PDF table of coordinates)
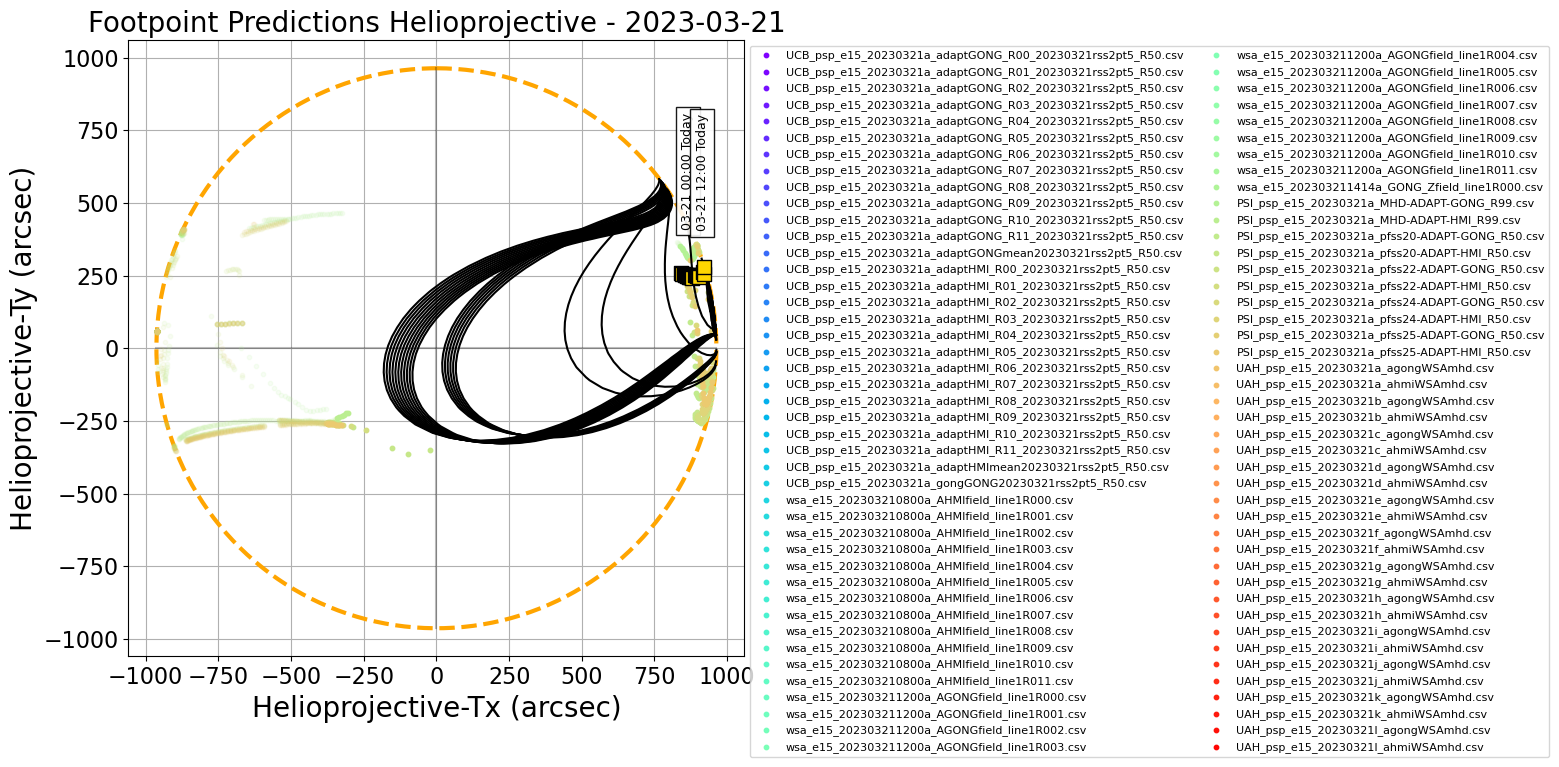
Figure 1.
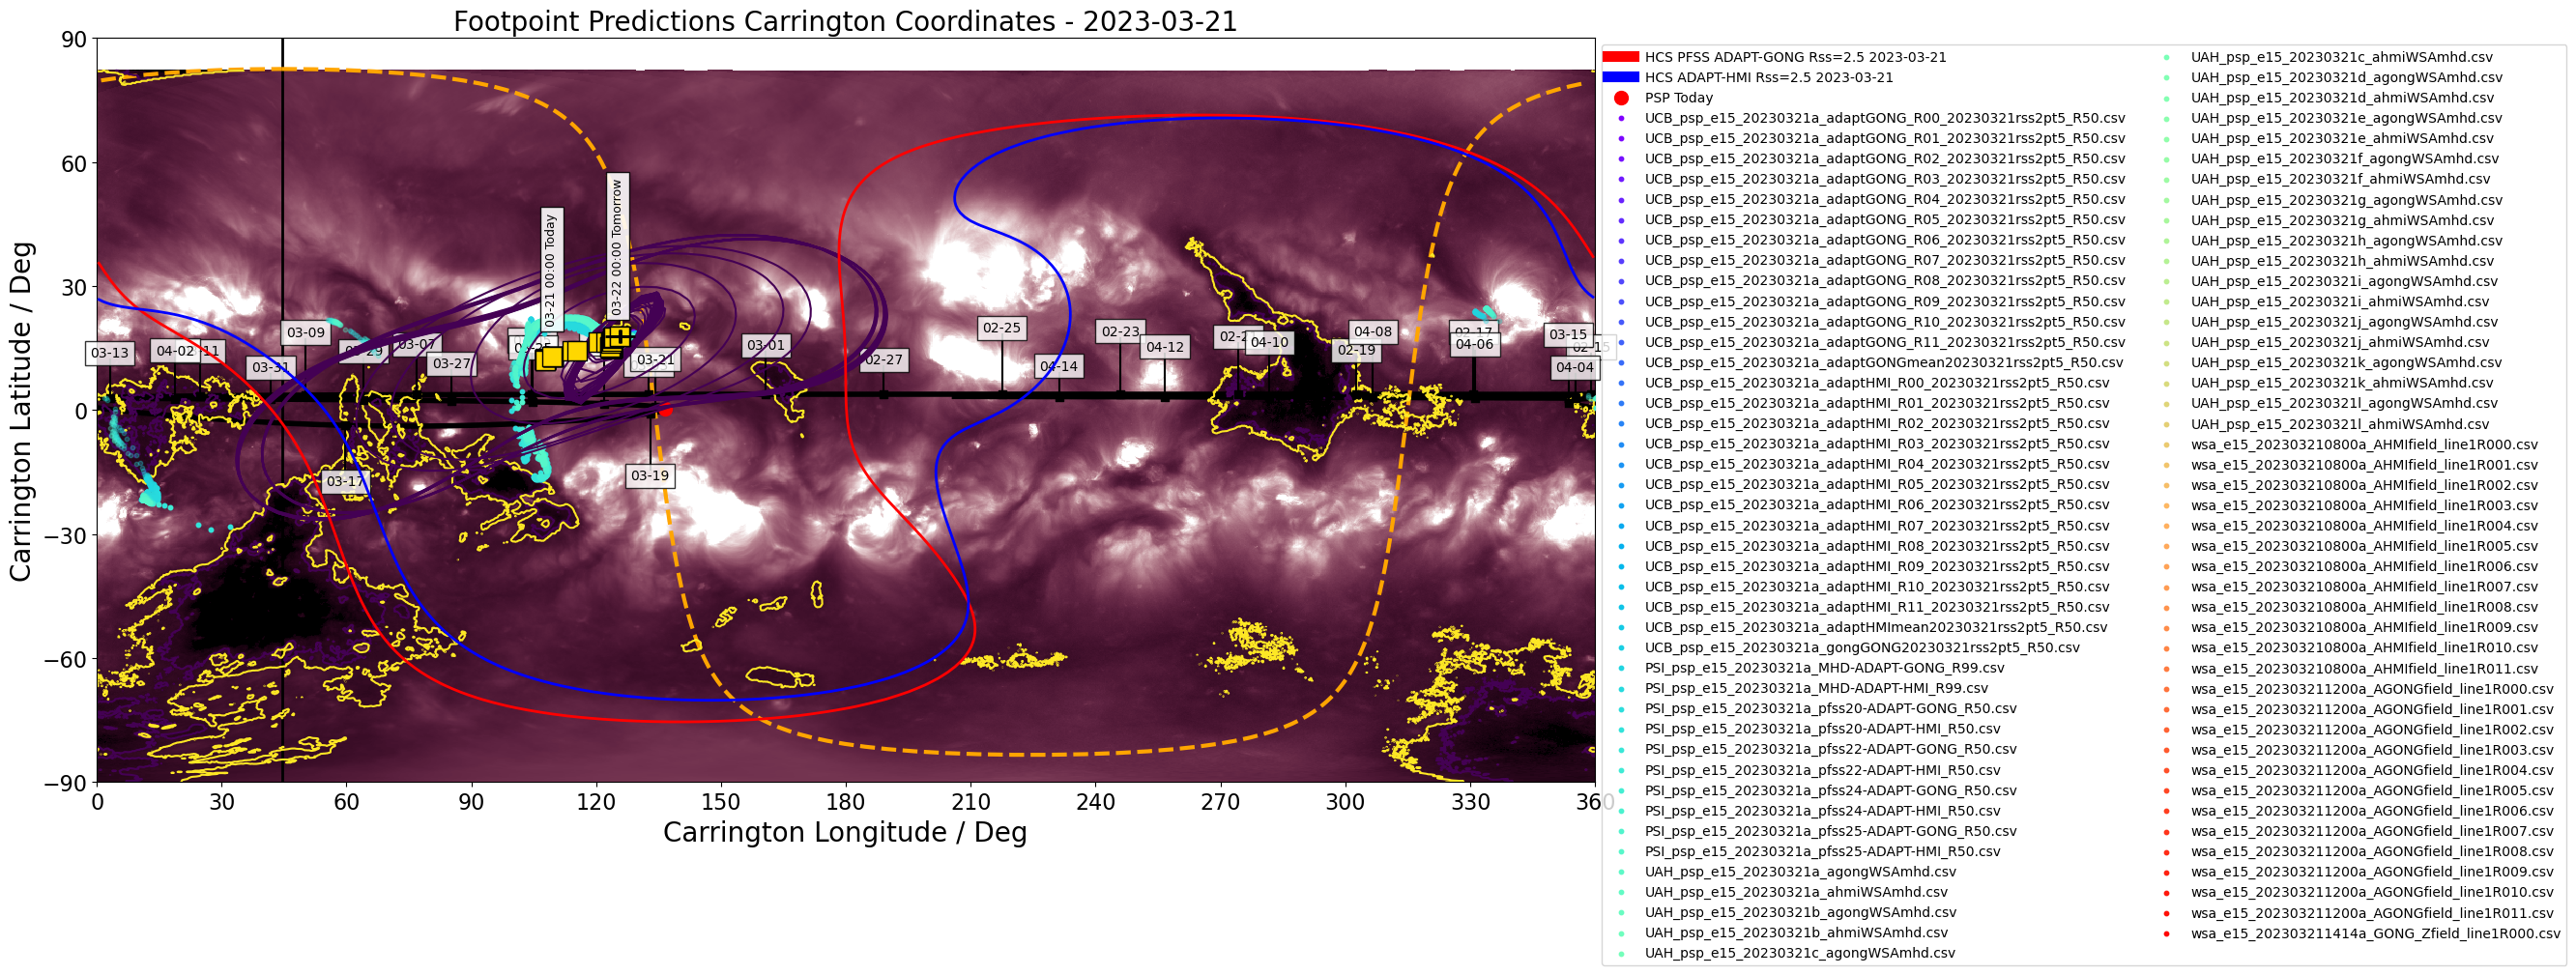
Figure 2.
Figures above show one footpoint per day plotted on the solar disk and in Carrington coordinates (click on figure to zoom and see caption).
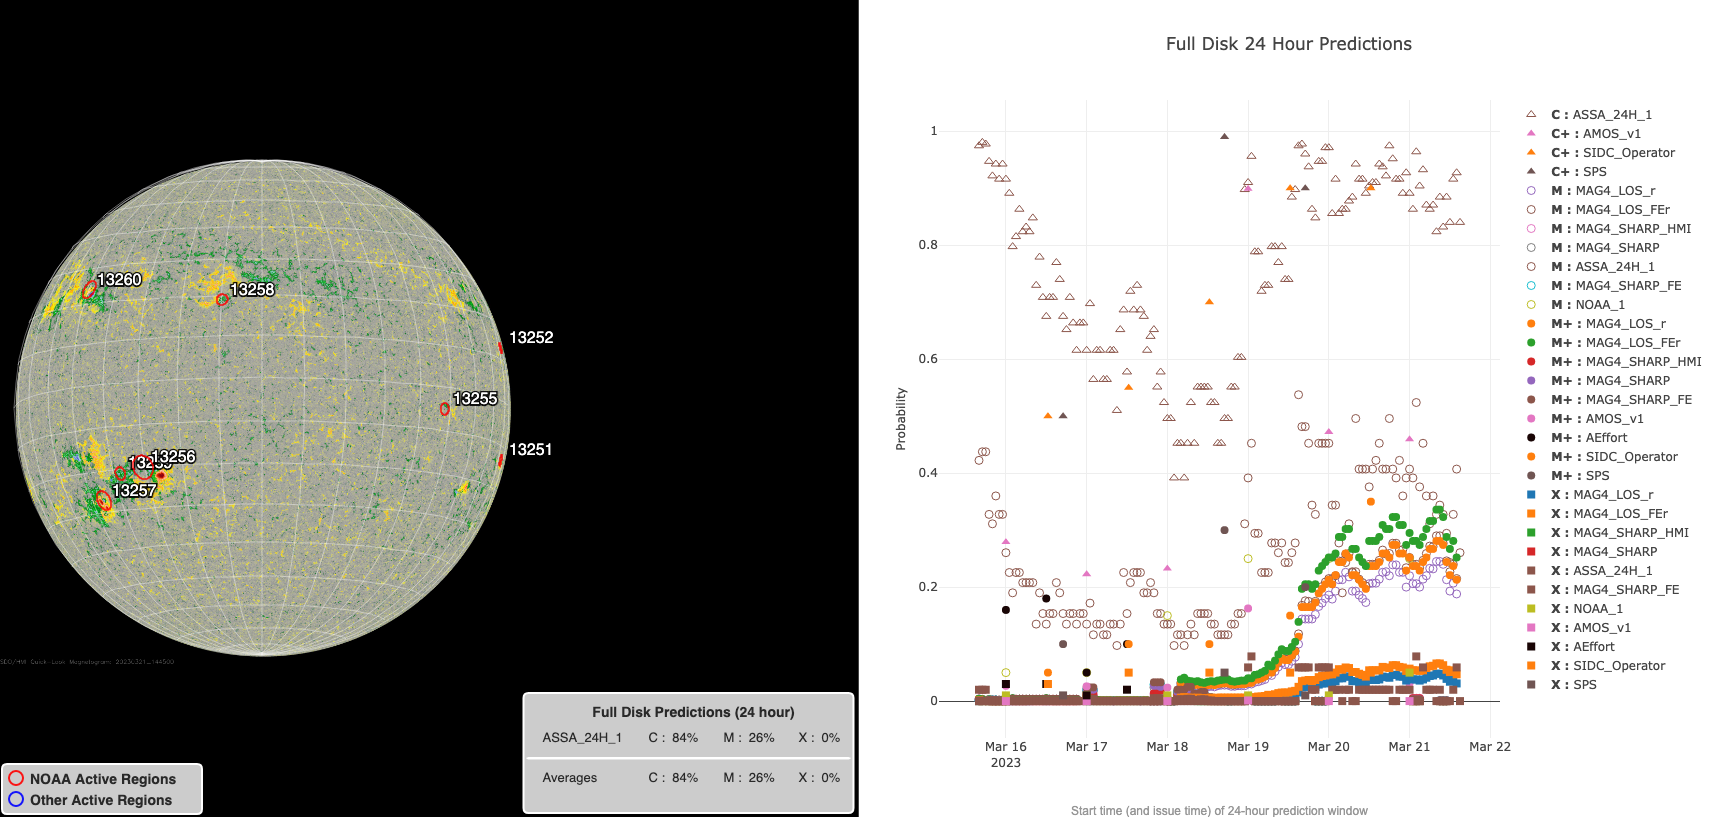
Figure 3.
The predicted footpoints were kindly provided by the PSP 15th Perihelion modeling team.
Encounter 15 Prediction update #7 2023/03/21
This is final prediction for E15.
Predictions of Parker's footpoints remain in the northern mid-latitude active region and are expected to essentially co-rotate with the source over the West limb by today evening (UTC).
Today's update:
The final consensus prediction remains in the northern mid latitude active region band, right on top of the West limb. Predicted limb passage is identical to yesterday at 1900UT today 3/21.
Flare prediction (via CCMC):
Solar activity remains low. Predictions from the CCMC Flare Scoreboard are currently estimating a slight probability of M-class flares from the visible disk (26%) and a high chance of C-class flares (84%). There is very low probability for X-class flares (0%). Max Millennium is focusing on AR 13256 for flare observations.
*** Please note the "arrival time" and "emission time" and associated Tx/Ty coordinates for both reported in the consensus CSV file. The attached plots show the "arrival time" (location of source at time that plasma will arrive at Parker). See https://docs.google.com/presentation/d/1mz02FU24vqKxxLRaJlyScfAh8gB07iOlBsTHApvhls8/edit#slide=id.p for some discussion on these***.
Date and arrival time of plasma parcel at PSP, consensus carrington longitude (deg), latitude (deg), error in longitude, error in latitude, on-disk position of predicted source in X and Y (arcseconds) at arrival time, date and emission time of plasma parcel at the source, on-disk position of predicted source at time parcel is emitted. Each row is the updated source location each hour.
The consensus is generated by forming a distribution of footpoint predictions from all modelers for each hour period, and attempting to fit a Kent distribution. If the fitting fails, the median in longitude and latitude are quoted. If the fitting is successful, the quoted errors are formed by drawing random samples from the fitted distribution and computing the standard deviation in longitude and latitude of those samples. If the fitting fails, the quoted errors are the standard deviation in the longitude and latitude from the raw distribution of predictions. The full shape of the distribution is described by black contours in the associated plots on this website. More details about the procedure can be found at the following preprint of Badman et al. (2023) "Prediction and Verification of Parker Solar Probe Solar Wind Sources at 13.3Rs"
Please note the carrington coordinates (lon,lat) are valid from the quoted timestamp (in UTC) until the next timestamp. The helioprojective coordinates quoted (HP-Tx, HP-Ty) are computed from the carrington coordinate at the quoted timestamp (e.g. midnight UTC each day) and so are valid instantaneously at this time but will corotate with the Sun until the next quoted timestamp. For a discussion of the subtle difference in emission and arrival time and why both are included please see the slide deck.
Individual model prediction tables of coordinates may be found in a Public DropBox. Files in the Public DropBox have three-letter identifiers indicating the associated model (see below).
Three-letter designation for Public DropBox: UCB. Kindly provided by Sam Badman. The model is a simple ballistic propagation from PSP down to the source surface assuming slow wind 360km/s, and then tracing this sub-PSP trajectory through a PFSS model to get footpoints at the photosphere. The source surface height here is 2.5Rs. The PFSS model is generated using various ADAPT maps with GONG and HMI as input, and the model is run using the open source pfsspy package. A more detailed explanation of the model and comparison to PSP E1 results are given here.
Three-letter designation for Public DropBox: PSI. Kindly provided by Pete Riley. For these predictions, PSI is using a combination of modeling approaches, including PFSS solutions, empirically-based polytropic MHD solutions, and a more sophisticated approach that includes the effects of waves and turbulence to heat the corona and the WKB approximation for wave pressures to accelerate the solar wind. Additionally, boundary conditions are derived from both HMI and ADAPT synoptic magnetograms. Together, these allow us to generate a rich set of ensemble realizations from which to make our optimal prediction, as well as pool them with other teams’ forecasts to derive a hyper-ensemble prediction.
Three-letter designation for Public DropBox: wsa. Kindly provided by Shaela Jones. The Wang-Sheeley-Arge (WSA) model is a combined empirical and physics-based model of the corona and solar wind. The coronal portion of the Wang-Sheeley-Arge (WSA) model is comprised of the Potential Field Source Surface (PFSS) and Schatten Current Sheet (SCS) models, where the output of the PFSS model serves as input to the SCS model. The solar wind portion of WSA consists of a simple 1-D kinematic propagation code that takes stream interactions into account in an ad-hoc fashion. It provides predictions of the solar wind speed and interplanetary magnetic field IMF polarity at any specified point in the inner heliosphere. The WSA model can use global maps of the photospheric magnetic flux measurements from a number of sources as its inner boundary condition; here we are using an ensemble of maps from the Air Force Data Assimilative Photospheric Flux Transport (ADAPT) model, based on input GONG magnetograms.
UAH predictions come from the University of Alabama, Huntsville Multiscale Fluid-Kinetic Simulation Suite (MS-FLUKSS, Pogorelov et al. (2014); Pogorelov (2023); Singh et al. (2022)), which can solve the Reynolds-averaged ideal MHD equations for the mixture of thermal and nonthermal solar wind ions coupled with the kinetic Boltzmann equation describing the transport of neutral atoms. An adaptive mesh refinement technique can be employed for efficient high-resolution calculations. The MS-FLUKSS heliospheric MHD model is coupled with the WSA model (Kim et al., 2020), which uses both ADAPT-GONG and ADAPT-HMI input magnetograms, with the PFSS source surface height and the WSA outer boundary at 2.5 and 10 solar radii, respectively. Hence, field line tracing is performed through the MHD domain down to 10 solar radii instantaneously at approximately 1 hour cadence, where the origin of the field line on the photosphere is already known, as described for WSA.
see Prediction and Verification of Parker Solar Probe Solar Wind Sources at 13.3Rs, Badman et al. (2023)
