


During the PSP 4th perihelion, our contributing observatories were taking observations. We will collect highlights of these observation here. If you have an observation you would like included, please send an image with an appropriate caption.
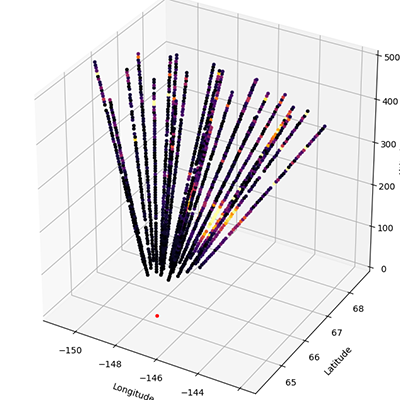
3D volumetric images of ionospheric plasma density (left) and a single beam (bottom right) measured by the Poker Flat Incoherent Scatter Radar (PFISR) with auroral green-line measurements from a co-located Meridian Scanning Photometer (top right). Measurements were taken on January 16, 2020 during a geomagnetic substorm near substorm onset. PFISR is able to resolve spatial and temporal structuring of the ionosphere in response to the substorm.
 in bottom-right of video for full-screen.
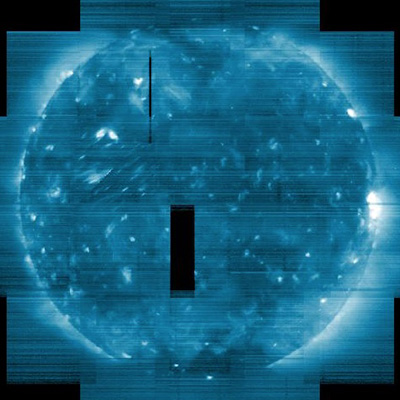
Hinode EUV Imaging Spectrometer scan of the solar disk taken on January 18-20, 2020. The image is constructed by re-pointing the spacecraft 15 times and stepping the spectrometer slit over the observed field-of-view. Exposures are taken every 30s in many different spectral lines. The data can be used to produce density, temperature, velocity, and elemental abundance maps. See, for example, Brooks et al. (2015), Nature Comm. 6, 5947. This image shows the solar corona at a temperature 1.8MK.
A jet of material is ejected near the south pole of the Sun at ~185 deg. PA on January 21, 2020 between 0:50 and 1:25 UT. This running subtraction movie was produced from the Mauna Loa K-Cor images with a field-of-view of 1.05 to 3 solar radii.
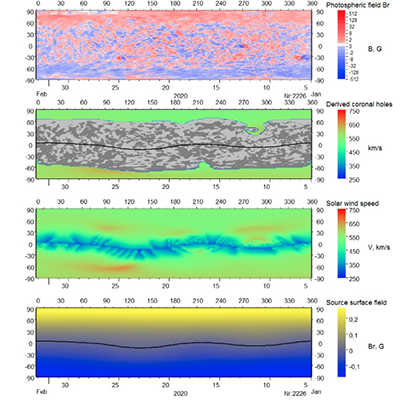
Kislovodsk Mountain Astronomical Station solar wind forecast for 2020-01-23.
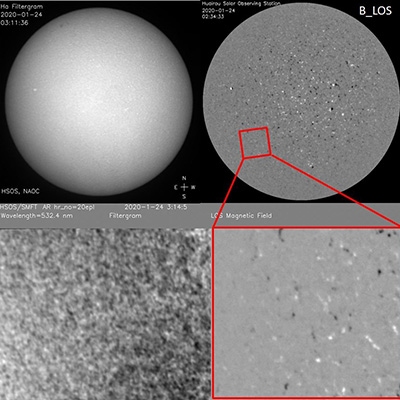
The top left and right panels are the full-disk Hα monochromatic images and line of sight photospheric magnetic fields taken with the Fe I 532.4 nm line from the Monitor of Solar Activity System. The bottom left and right panels represent the high-resolution photospheric monochromatic images and corresponding line-of-sight magnetic fields at Fe I 532.4nm line observed by 35-cm Solar Magnetic Field Telescope on Jan 24, 2020. The location as well as the field of view of the high resolution image on the full solar disk is marked by the red box in the top right image.

Full disk spectroheliogram of the Sun in He I 10830 Å on 26 Jan 2020 provided by the Crimean Astrophysical Observatory.
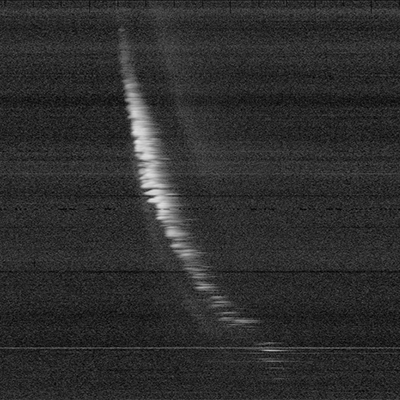
The Long Wavelength Array observed this Type III burst on Jan 28, shown on a frequency-vs-time plot known as a dynamic spectrum. The emission represents the outwards propagation of an electron beam exciting waves at the local plasma frequency (which depends on density) as it travels: the short-lived horizontal structures within the envelope of the burst are known as striae. The plot actually shows the degree of circular polarization in the emission, where the contrast is higher than in intensity for this burst.
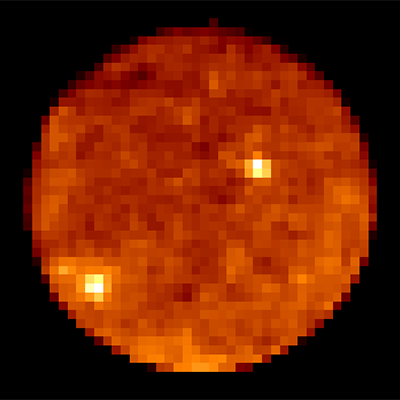
Solar radio images on January 28th at 18.8 and 24.7 GHz (thumbnail shows the 18.8 GHz image).
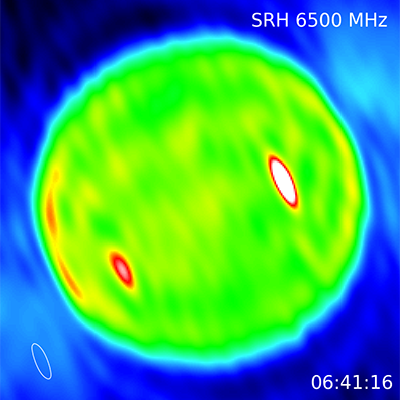
Full-disk images taken by SRH on Jan 29, 2020 at 6.5 and 7 GHz.
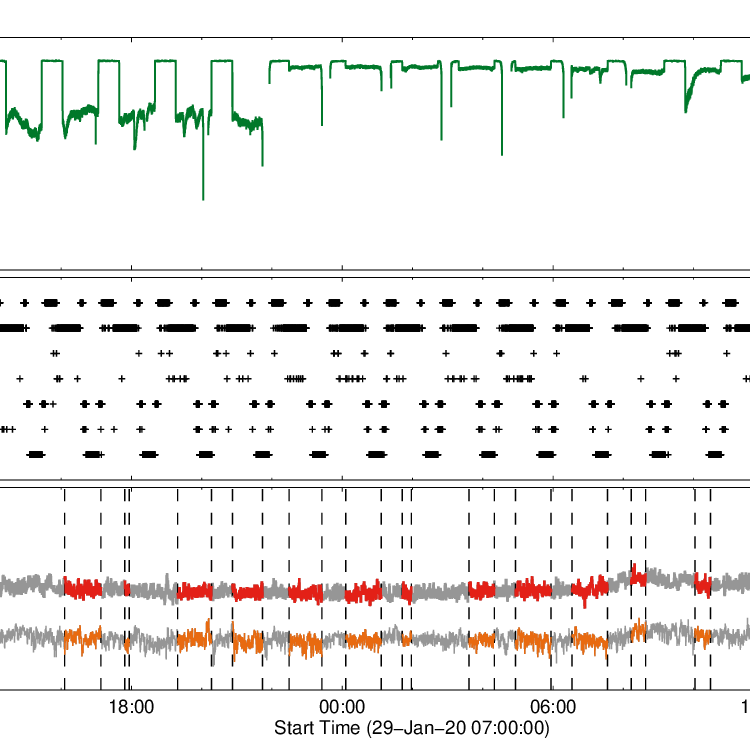
Time profile of NuSTAR observations through the January 2020 Parker perihelion. The time profile shows NuSTAR livetime (low values indicate on-Sun observation), the combination of star cameras in use, and the GOES flux with NuSTAR observing times highlighted.
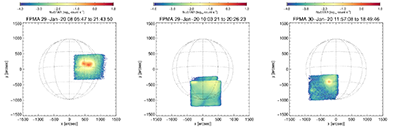
The three regions on the Sun that NuSTAR mainly targeted, including data from NuSTAR’s Focal Plane Module A:
See NuSTAR Jan 2020
Summary (PDF)
